Videos tagged 'StarDrop Hints and Tips'
-
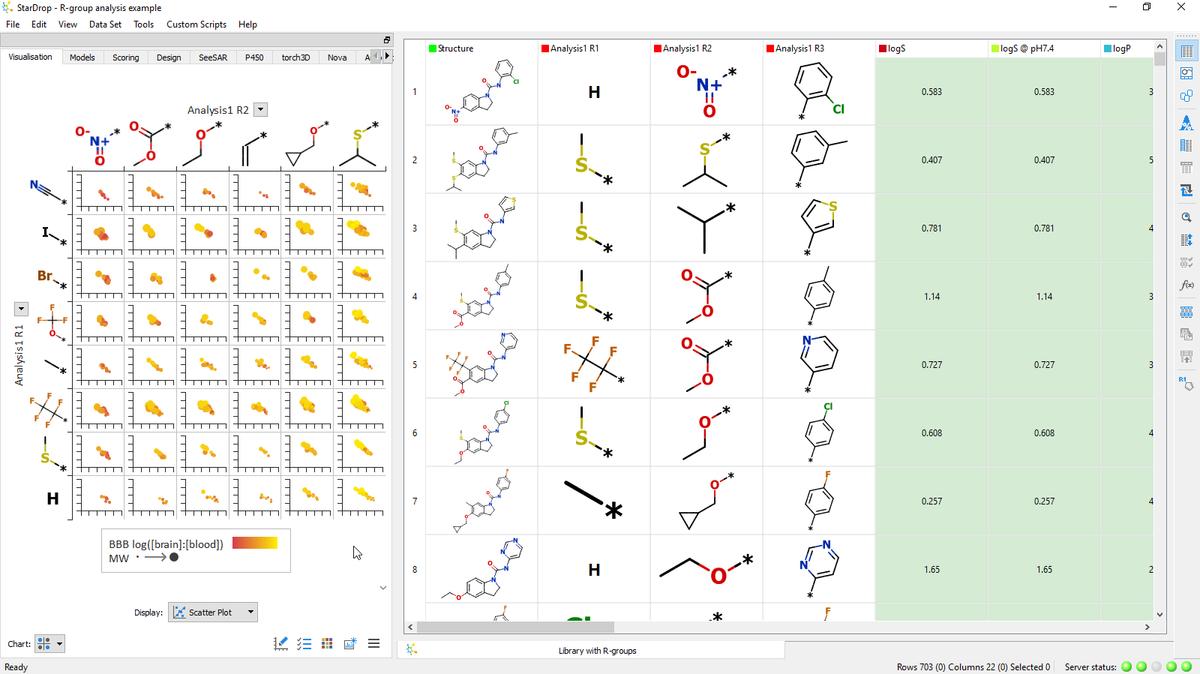
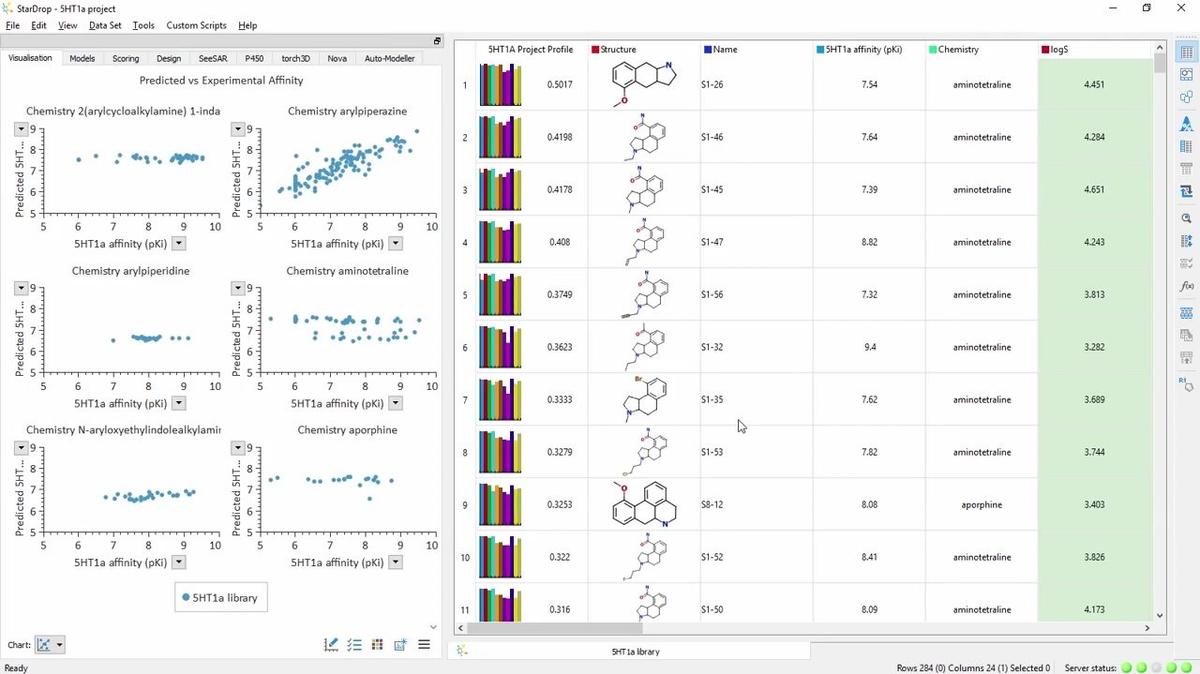
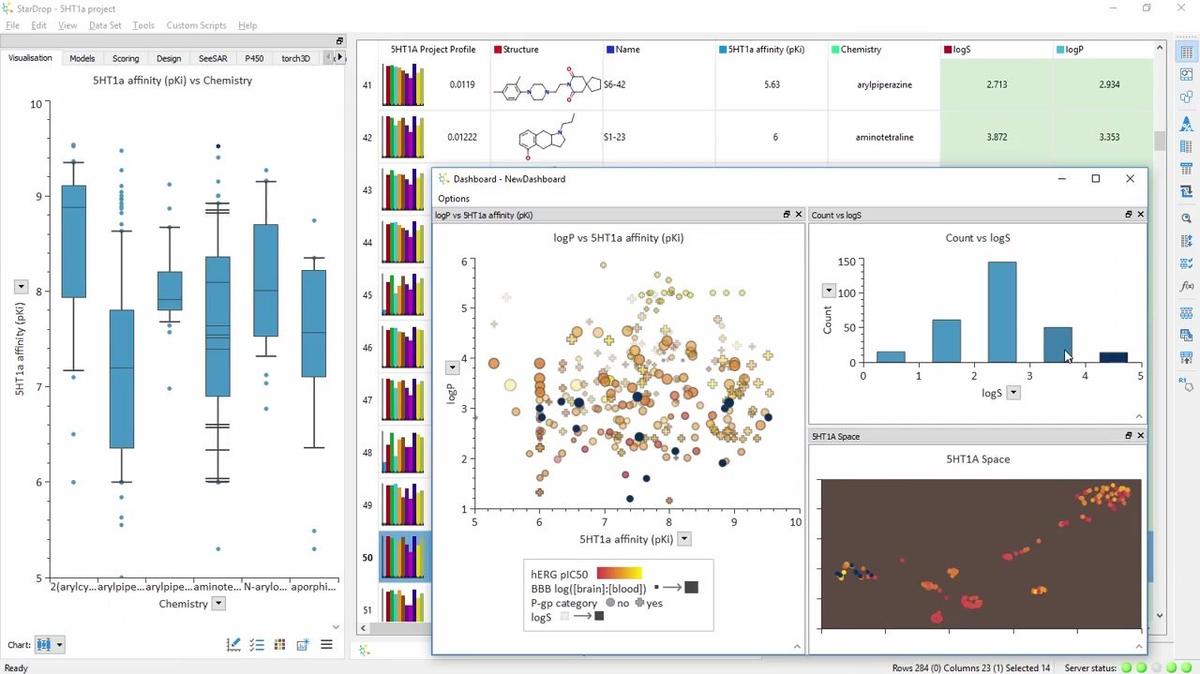
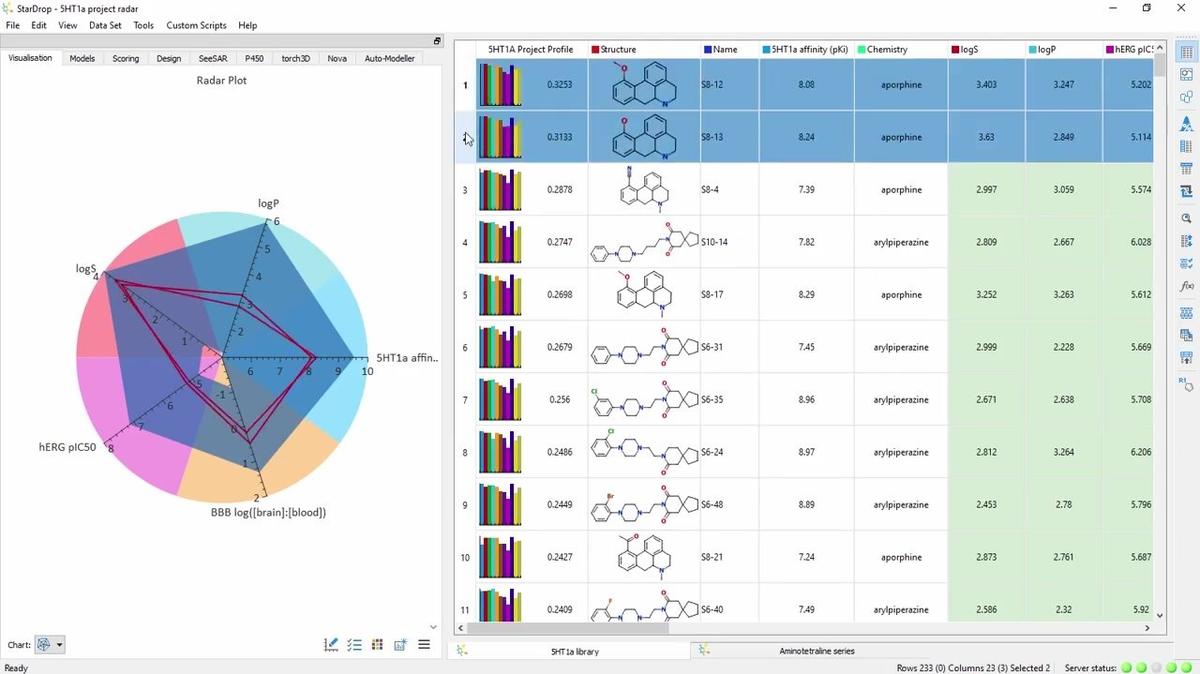
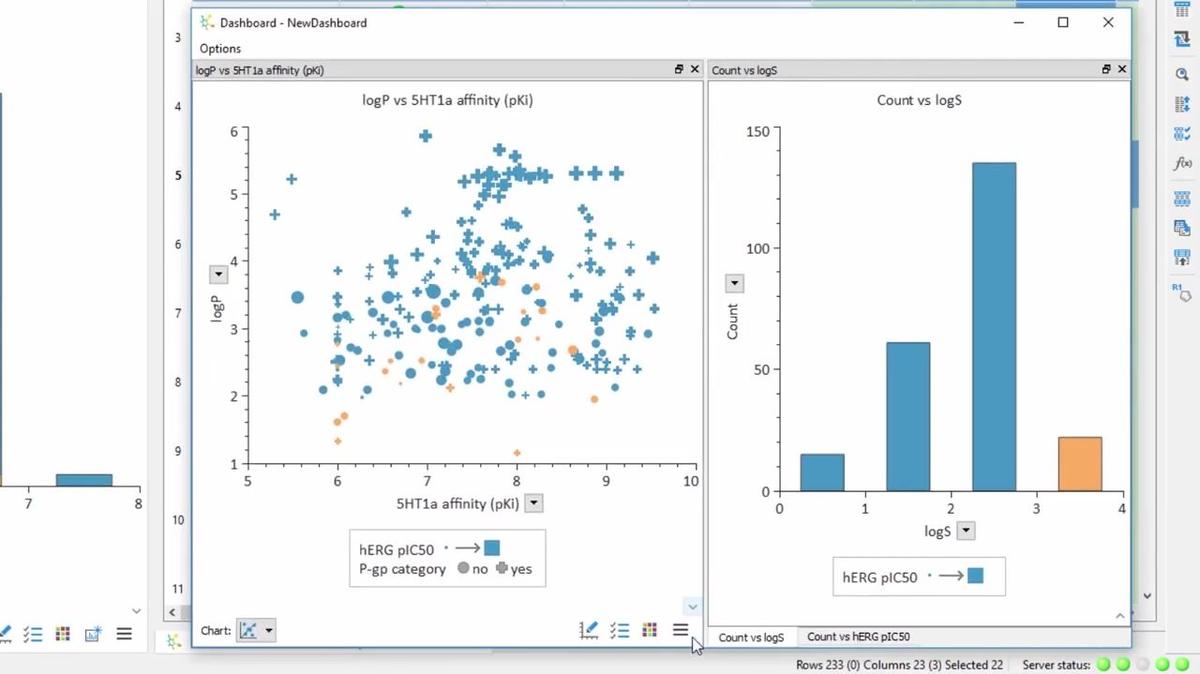
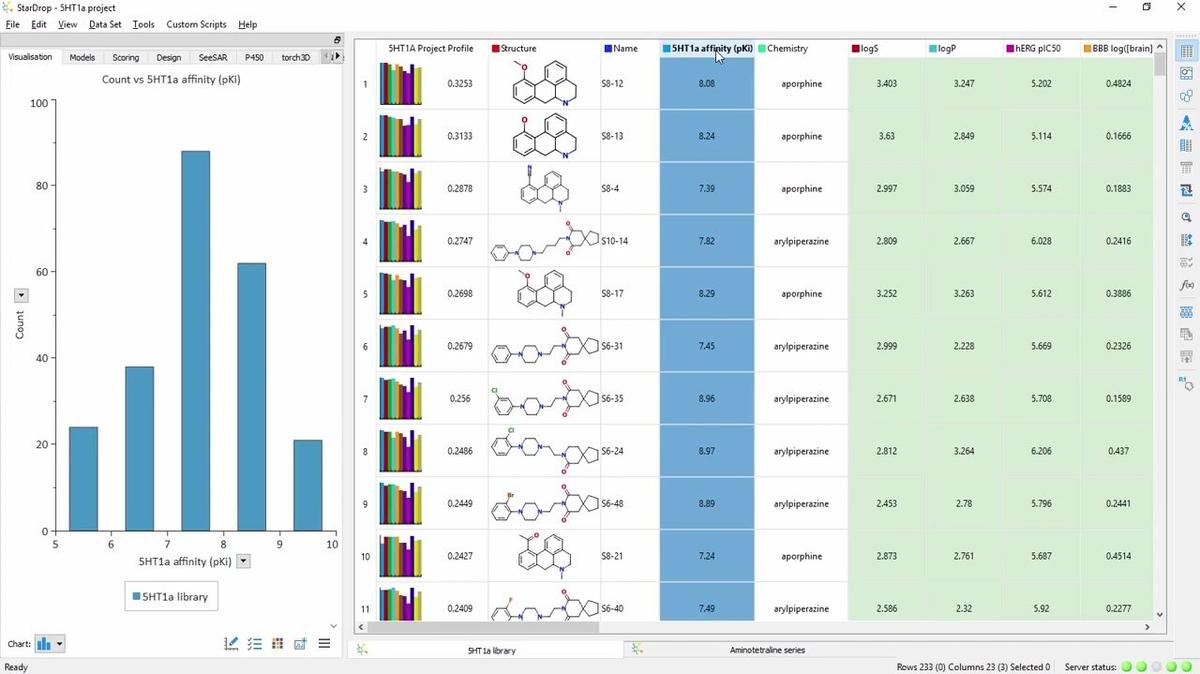
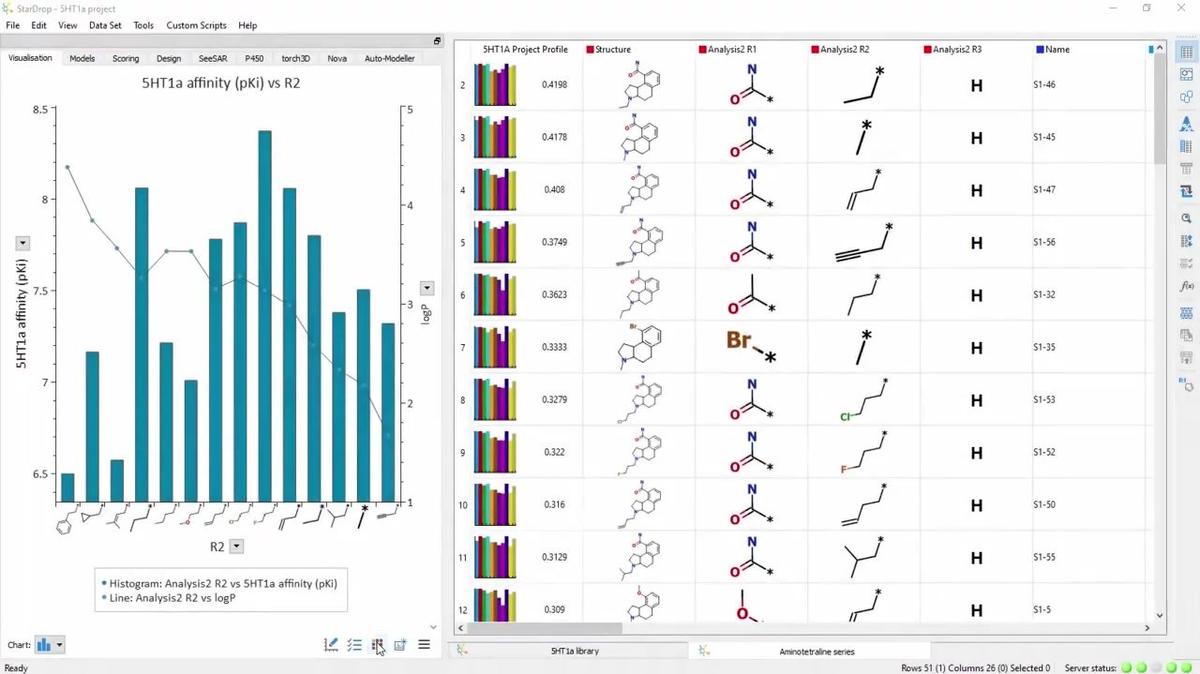
Hints and Tips: Information-Rich SAR Plots
This short video illustrates how to create information-rich SAR plots, including pie charts, histograms, scatter plots, radar plots, etc. to view property distributions by R-group in StarDrop's data visualisation area. In the next video in this series on R-group analysis, you can find out how to...
-
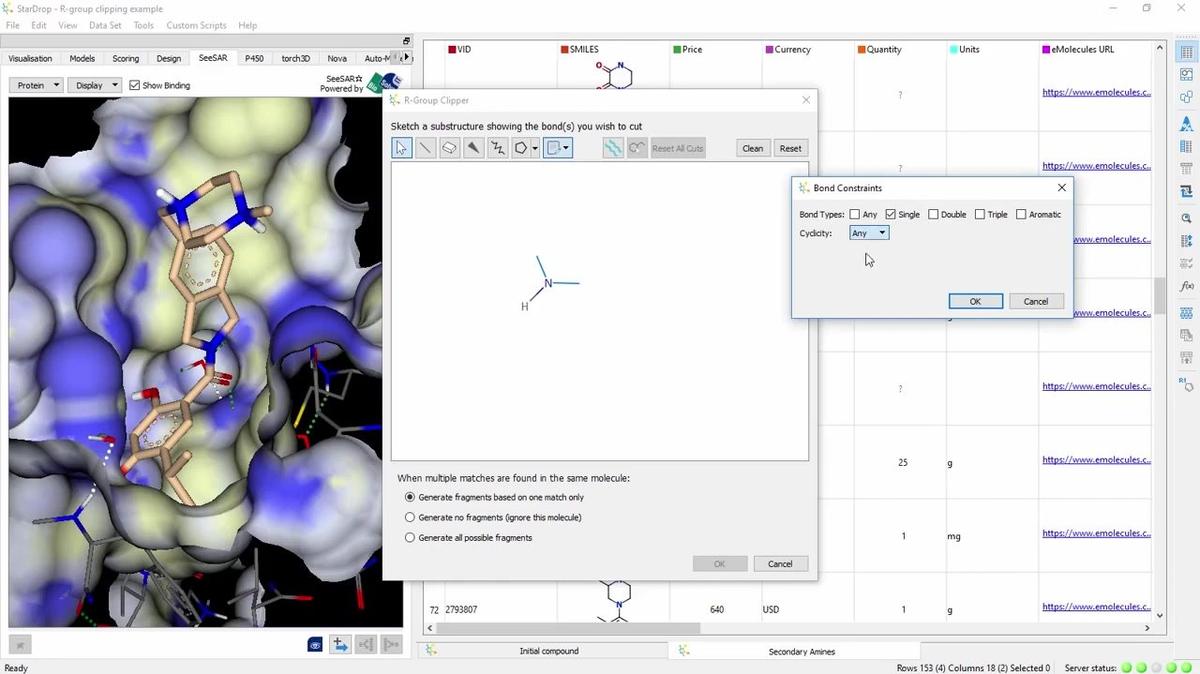
Hints and Tips: R-group Clipping
Matt Segall StarDrop's R-group clipping tool enables you to quickly transform chemical building blocks into their corresponding substituents. These can be immediately used to enumerate virtual libraries in StarDrop’s Nova module and explore new design hypotheses. This short video show you how...
-
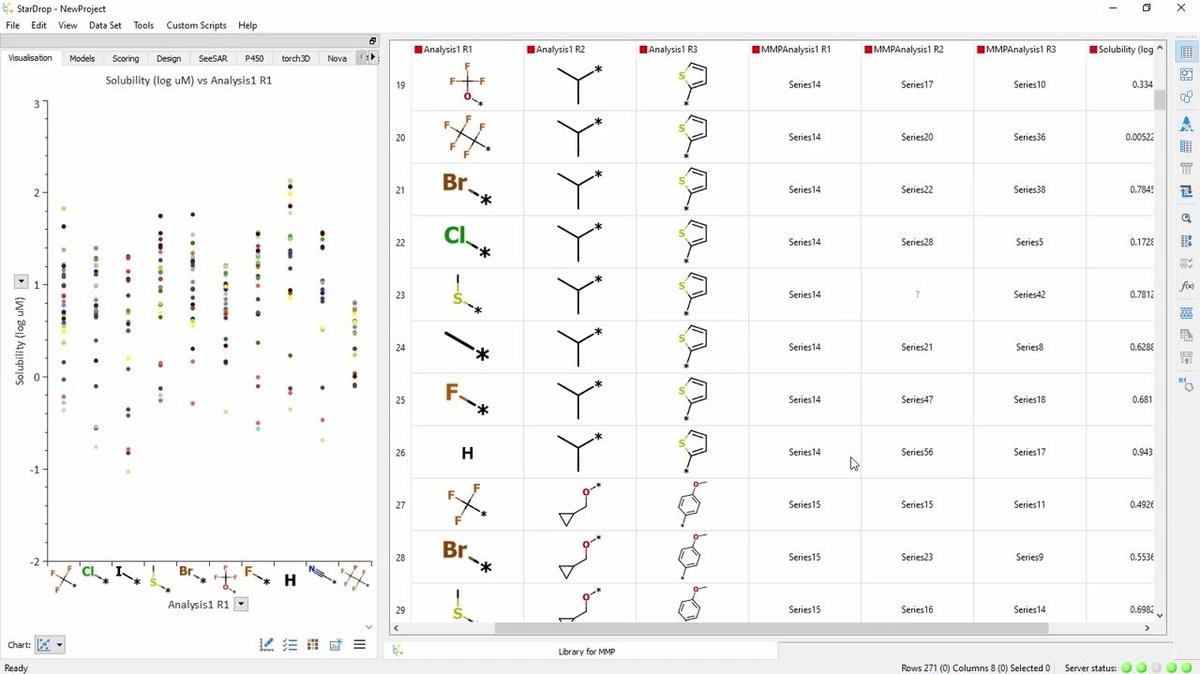
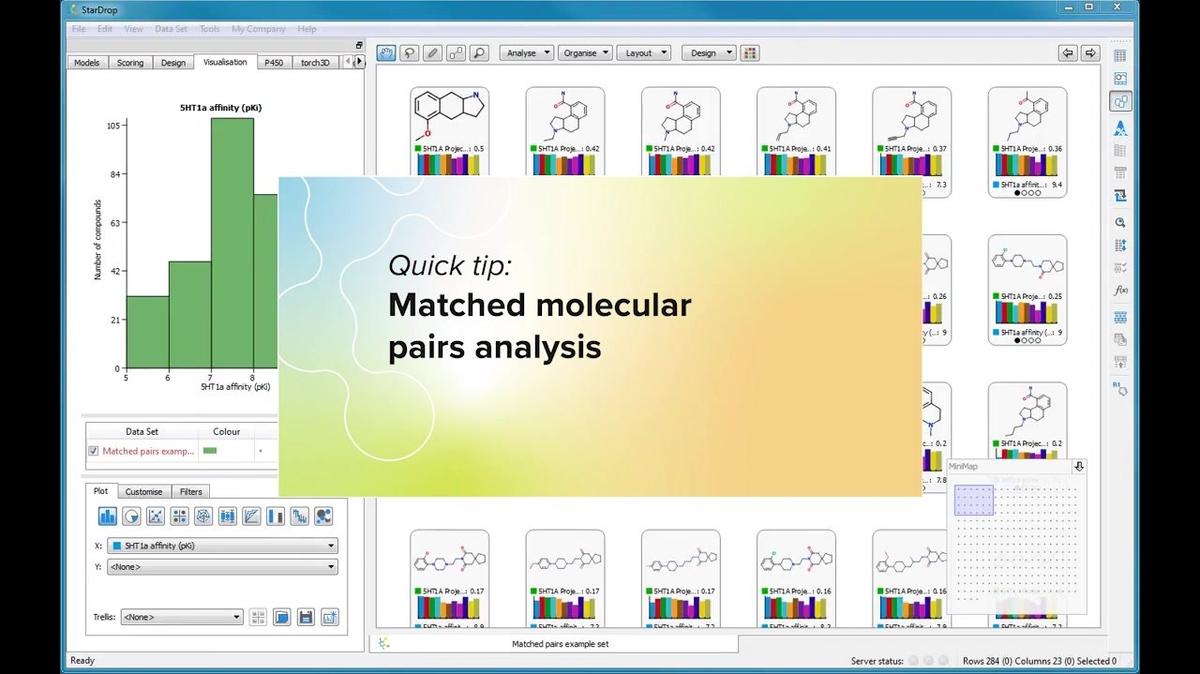
Hints and Tips: R-group Matched Pair Analysis
This short video illustrates how to perform Matched Molecular Pair Analysis (MMPA) within a chemical series using StarDrop's R-group analysis tool This is quite a specific form of MMPA and you may also be interested in the short video describing the general MMPA tool in StarDrop and how it can b...
-
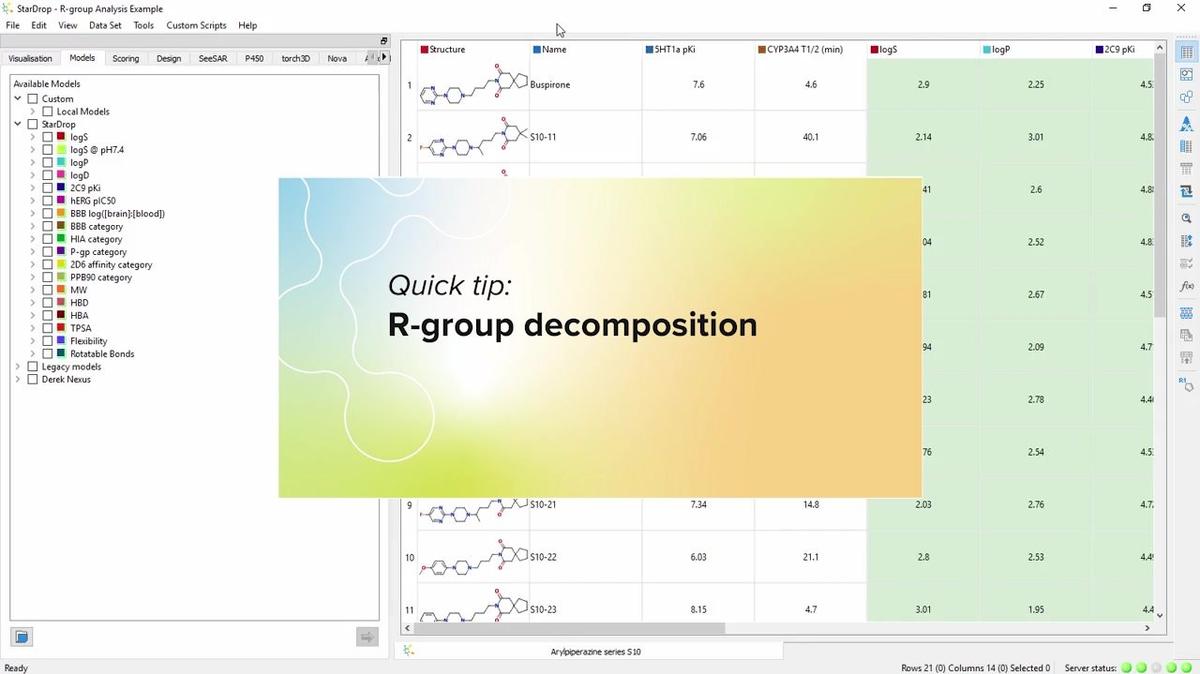
Hints and Tips: R-group Analysis
This short demo gives a quick introduction to how StarDrop's R-group analysis functionality can be used to explore the relationships between functional groups at different R-Group positions and a compound's properties. For more information on the scores which are in the example data set, take a l...
-
Hints and Tips: Trellising
A trellis enables you to compare the same chart for multiple categories of compound. This video shows you how, with just a few clicks. Next we'll see how to add multiple series to a single chart to show multiple trends or relationships in a single view.
-
Hints and Tips: Interacting with your Chart
In this quick video, we show the many ways you can interact with your chart to show exactly the data you wish and link visualisations with your data sets. The next video in the series illustrates how to create a dashboard with multiple interactive plots, to show an overview of your project at a ...
-
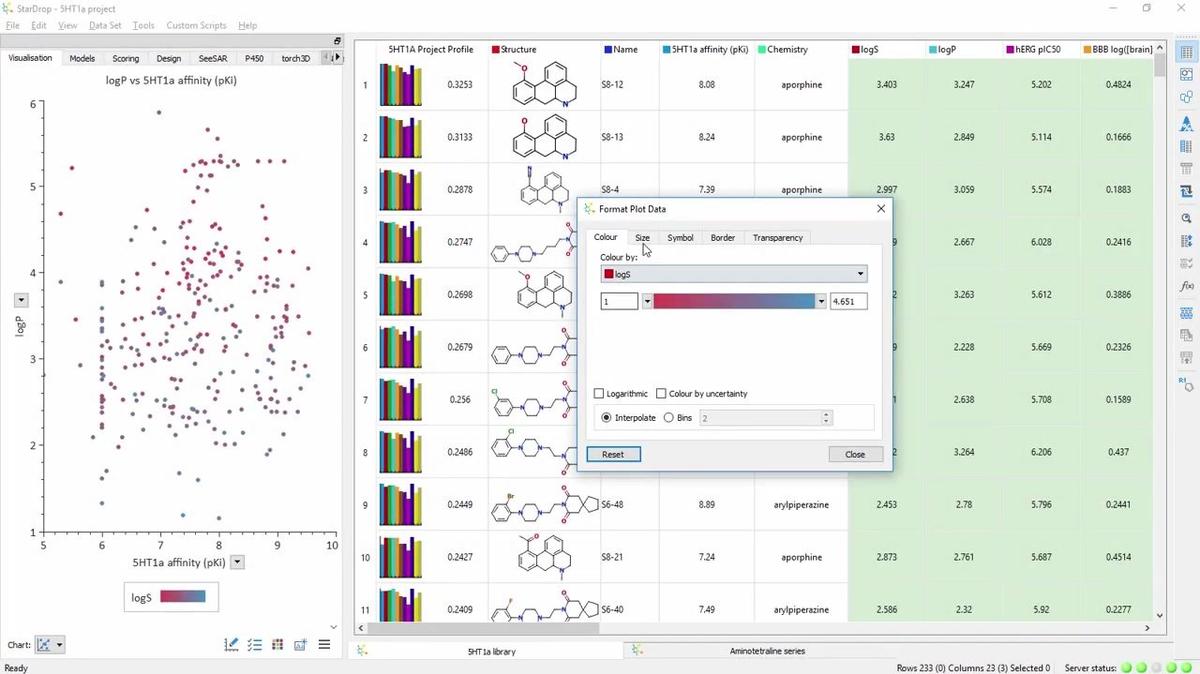
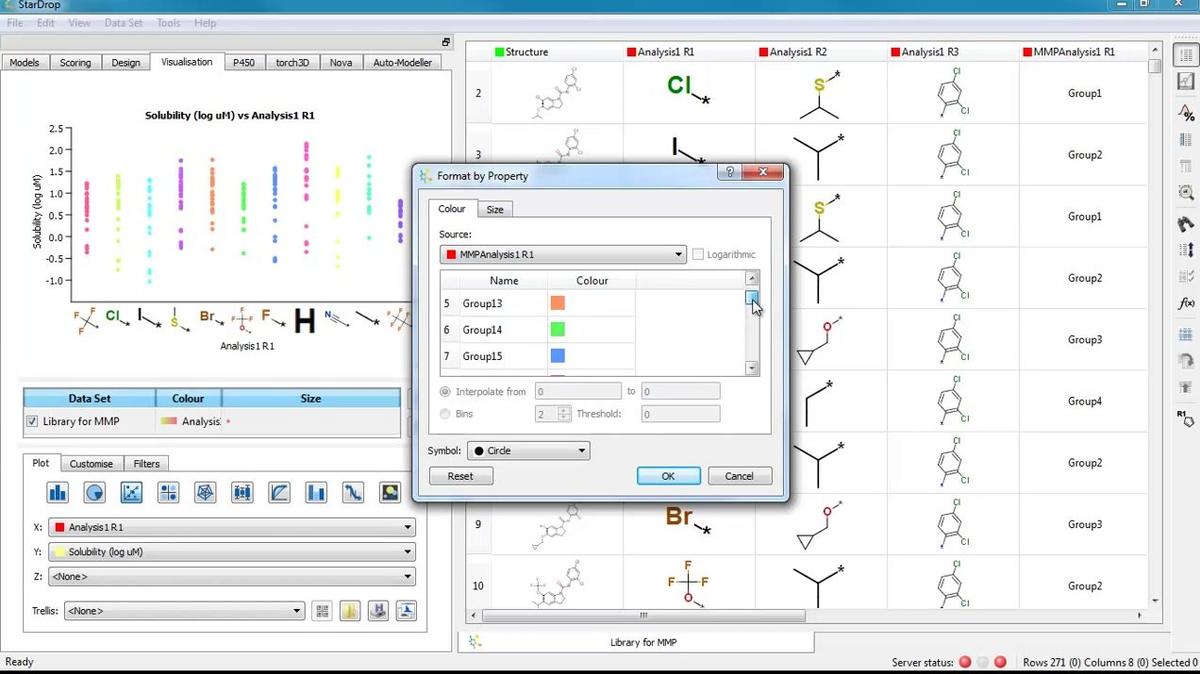
Hints and Tips: Formatting your Chart
This video demonstrates how to format your charts, using the properties in your data set, by colour, size, symbol, transparency... The next video shows the many ways you can interact with your charts to explore your data
-
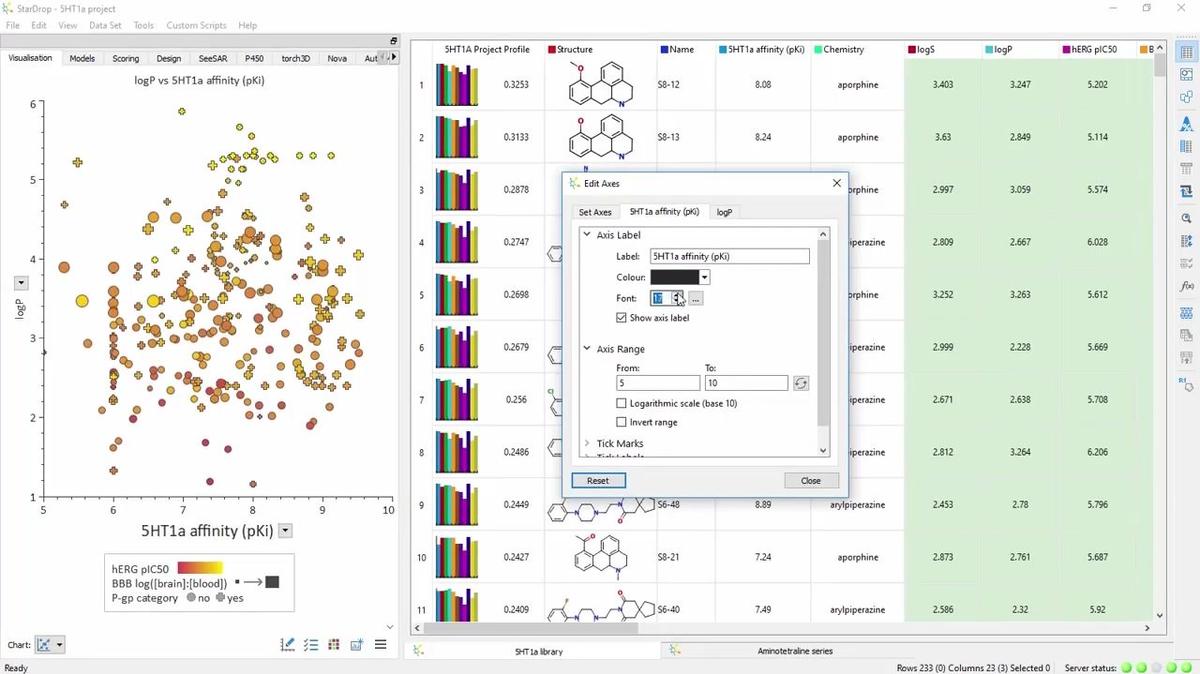
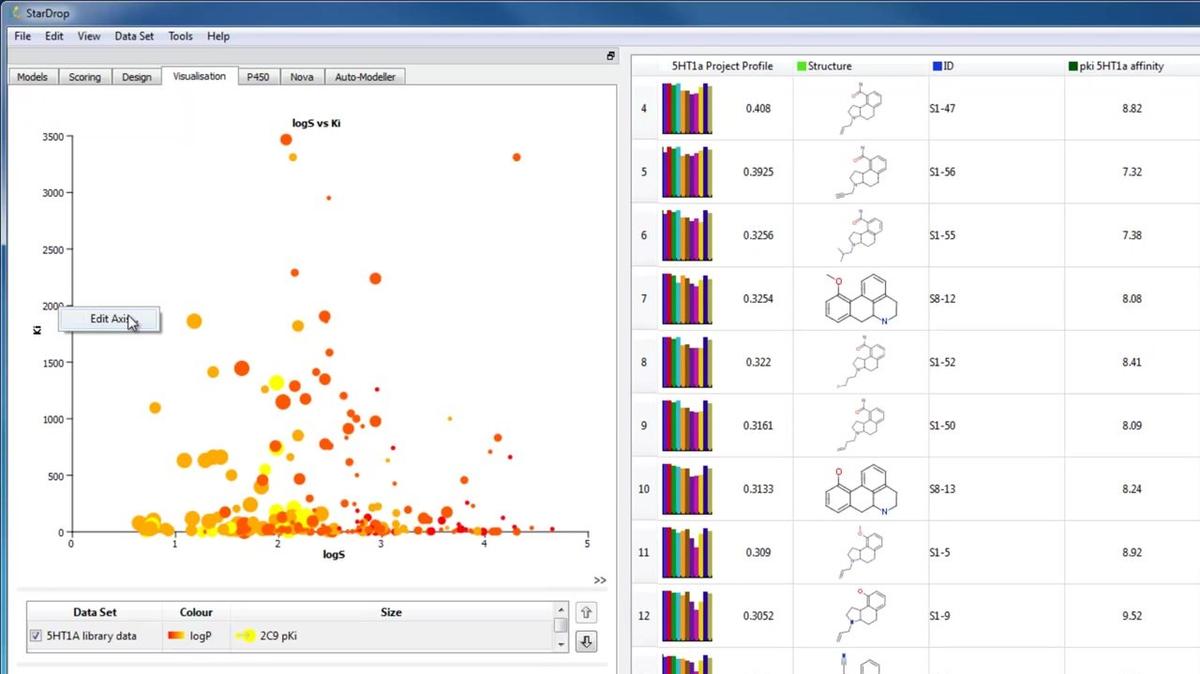
Hints and Tips: Editing Chart Axes and Title
Watch this video to see how you can edit the title of your chart and its axes, to precisely define their position, range, tick marks and labels. Next we'll explore how you can annotate your chart with labels to display structures and detailed data on key compounds.
-
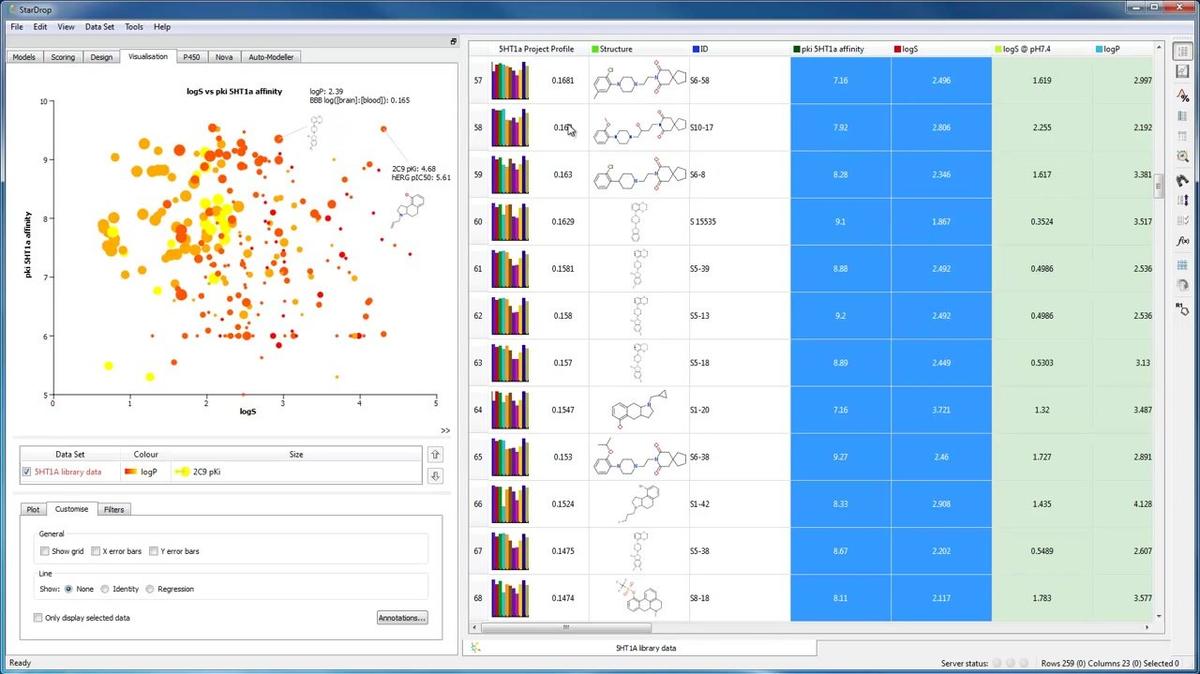
Hints and Tips: Data Visualisation Introduction
This short video gives an overview of StarDrop's rich data visualisation capabilities. The videos in the following series introduce how to quickly produce publication-quality charts and interactively explore your data. The next video in the series shows you how to get started by creating a chart.
-
Hints and Tips: Customising your Chart
To see some of the many ways you can customise your chart, by setting fonts and colours or adding grids and lines, watch this short video. Once you've created the perfect chart, you'll want to copy it into your presentation or report. Watch the next video to see how.
-
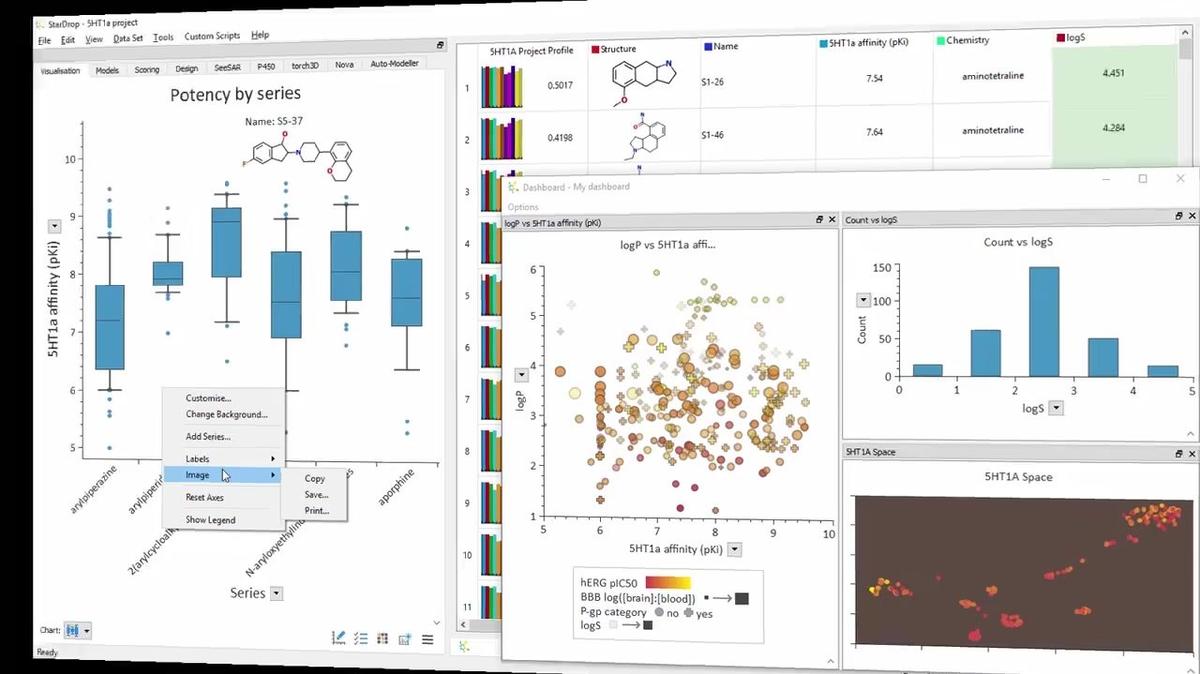
Hints and Tips: Creating a Dashboard
Here we'll see how to create a 'dashboard' containing multiple interactive charts, giving an instant overview of your project data. Follow the link to the next video in the series to learn how to edit your chart's axes and title to show the data exactly how you want.
-
Hints and Tips: Creating a Chart
This short video introduces how to use the visualisation area in StarDrop to quickly create a chart from your data The following video illustrates how to format your chart to represent more dimensions of data by colour, size, symbol, transparency...
-
Hints and Tips: Copying or Printing your Charts
In this video we show how easy it is to copy your charts directly into your presentations and reports or print them directly from StarDrop. Moving on to more advanced visualisation techniques, the next video in the series shows how to create a trellised chart.
-
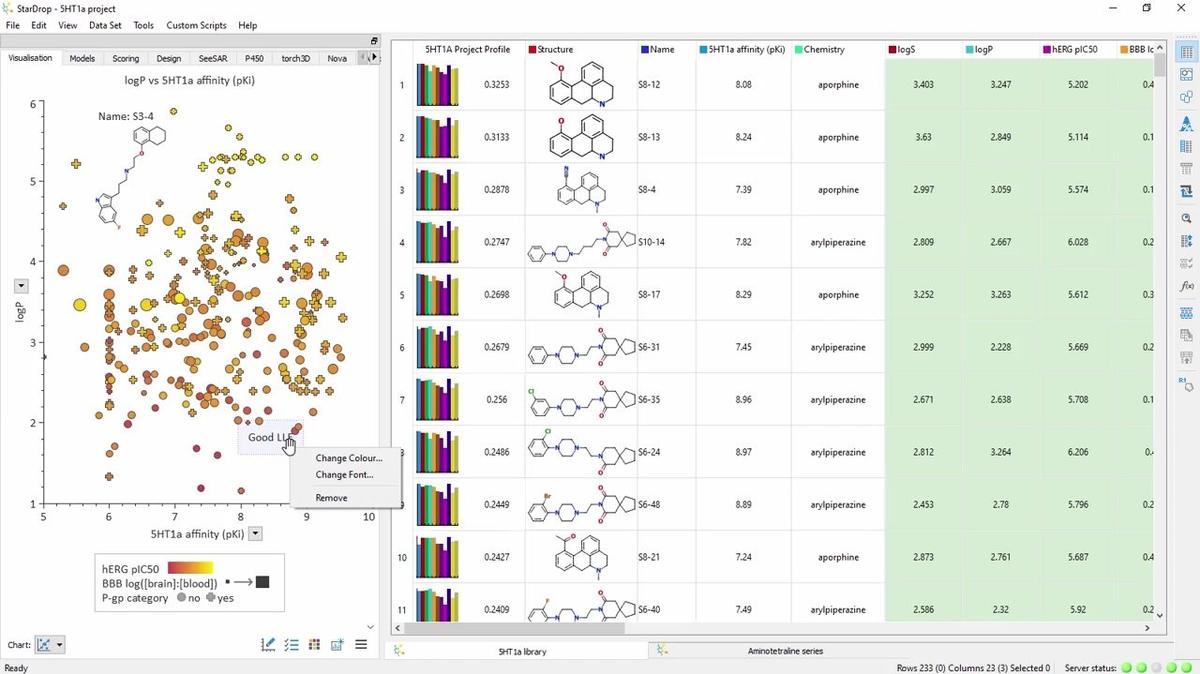
Hints and Tips: Annotating your Chart
You can add labels to your charts showing structure and data for key compounds or display your comments. Watch this quick video to see how... Next well explore the many ways to further customise you chart, for example by displaying regression lines, setting fonts and colours for your text, or ad...
-
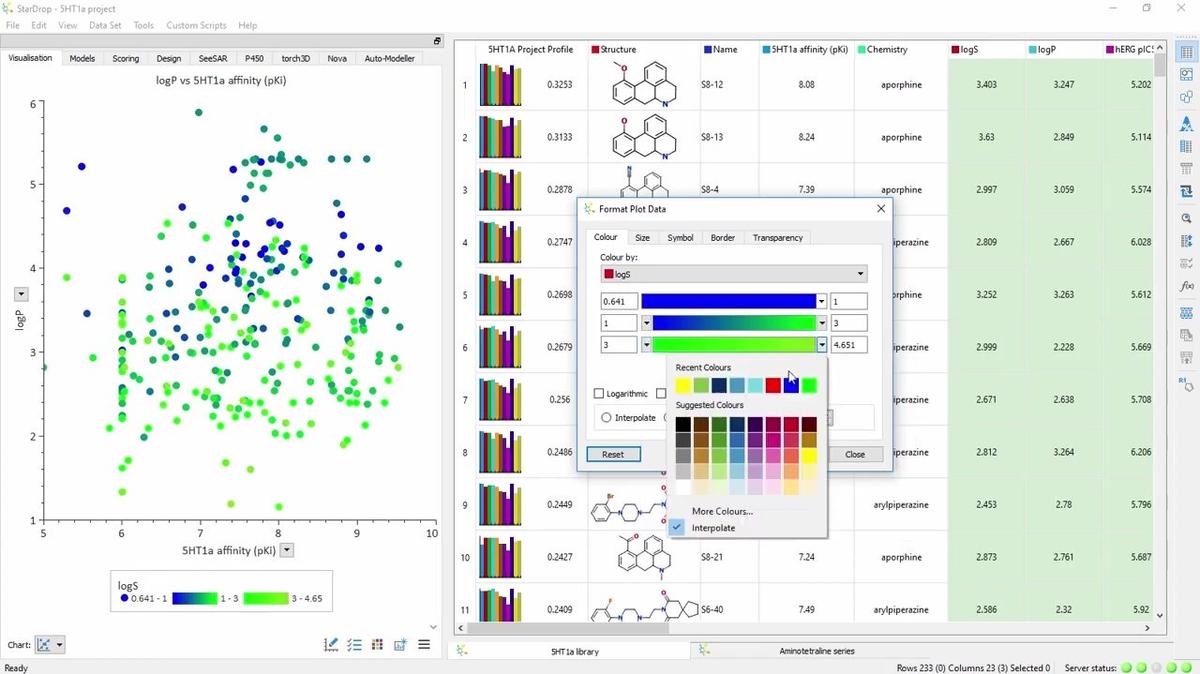
Hints and Tips: Advanced Chart Formatting
Here we'll show how to tailor the format scales in your charts to highlight the property ranges in which you're most interested. This is the last video in the visualisation series. We hope that you've found them useful and if you have any questions, please feel free to contact stardrop-support@o...
-
Hints and Tips: Adding Multiple Series to a Chart
You can create very information-rich visualisations by plotting multiple series on a single chart. In this video, we'll show you how... The final video in the series discusses advanced chart formatting to create more complex format scales and highlight the most important property ranges.
-
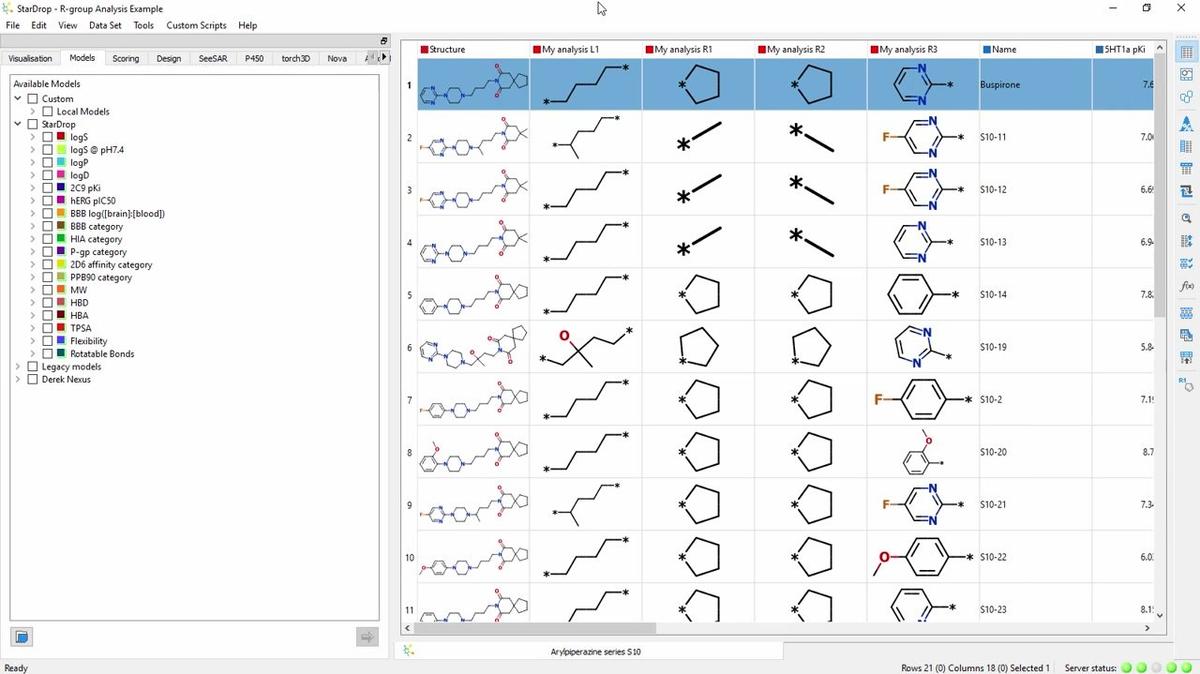
Hints and Tips: R-group Analysis
StarDrop's R-group analysis makes it quick and easy to explore the variation of properties by the substituents within a chemical series. This video shows how to perform an R-group decomposition and create SAR plots. The next video in this short series, illustrates how to create information-rich ...
-
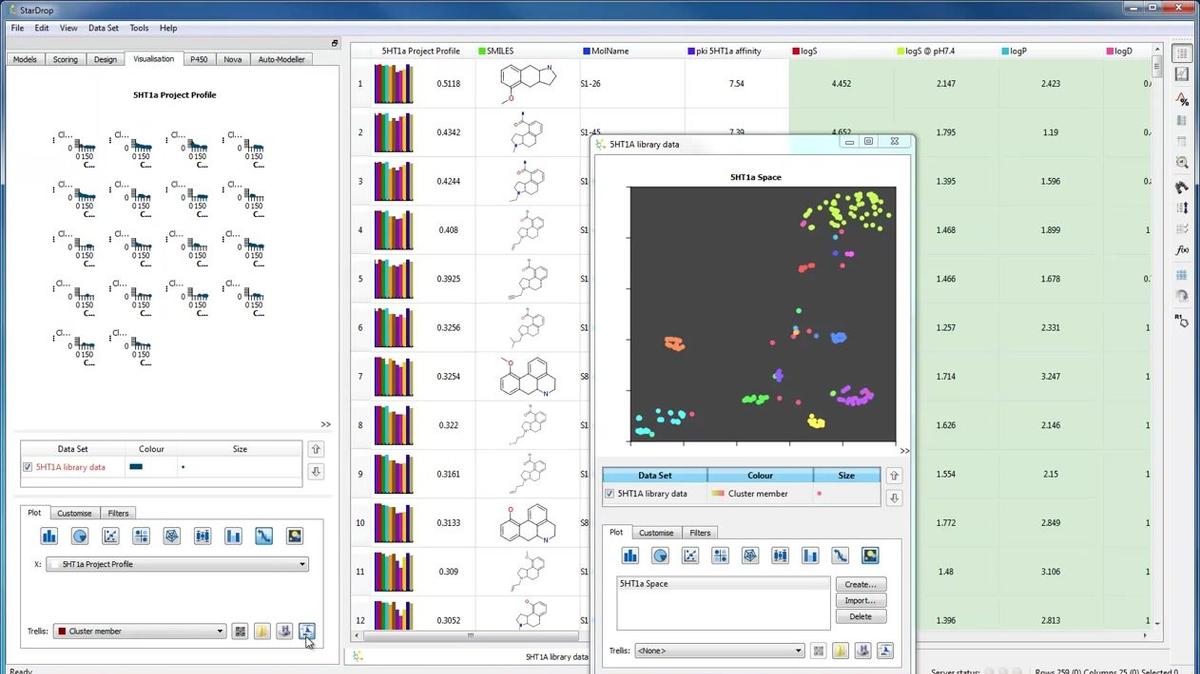
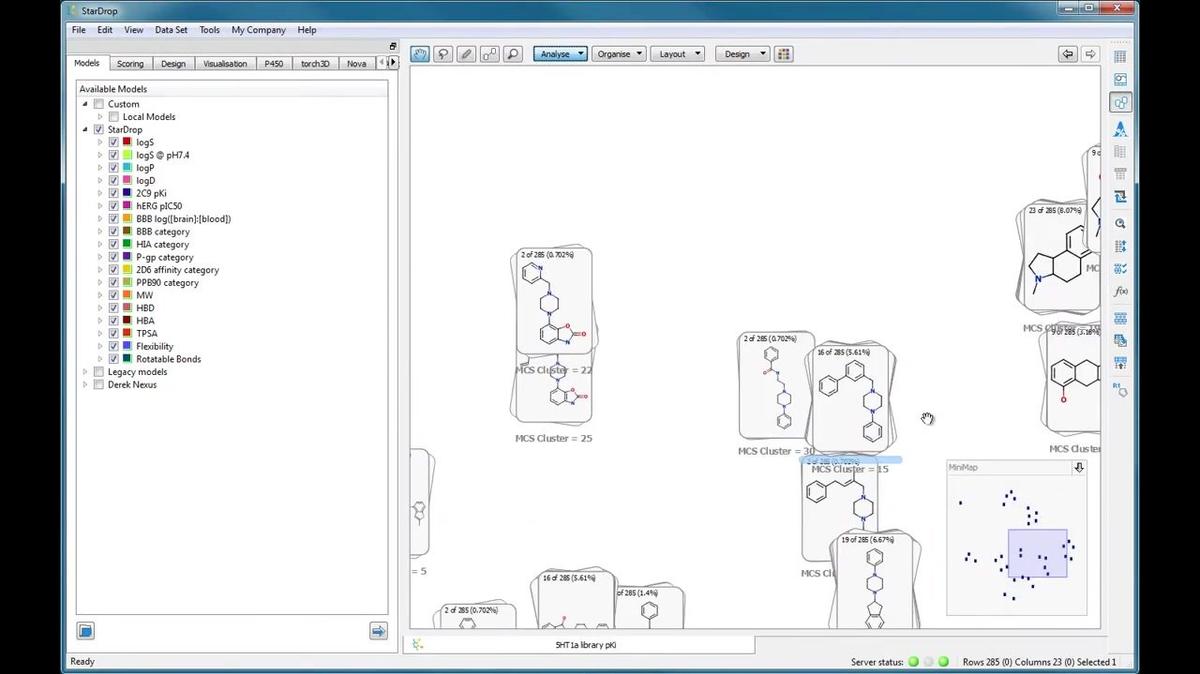
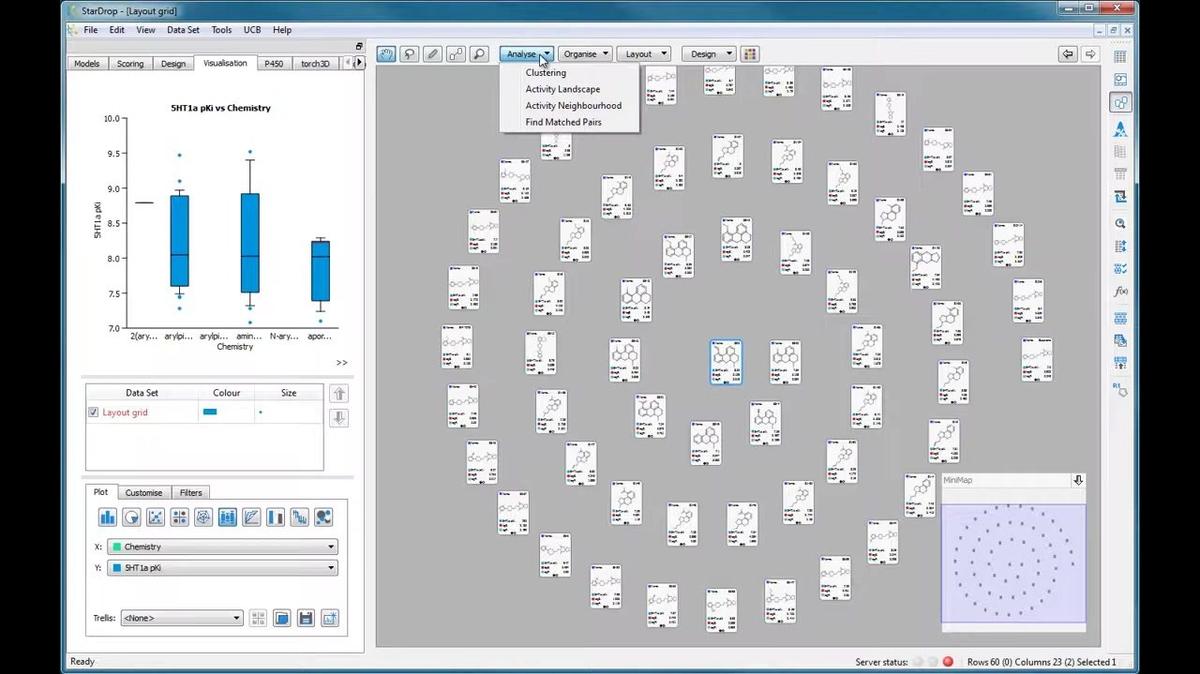
Clustering
The clustering tool makes it easy to identify groups of similar compounds within a dataset based on either their structure or properties. This demo shows how the cluster information can be used with StarDrop's chemical space and data visualisation to easily compare chemical series within a librar...
-
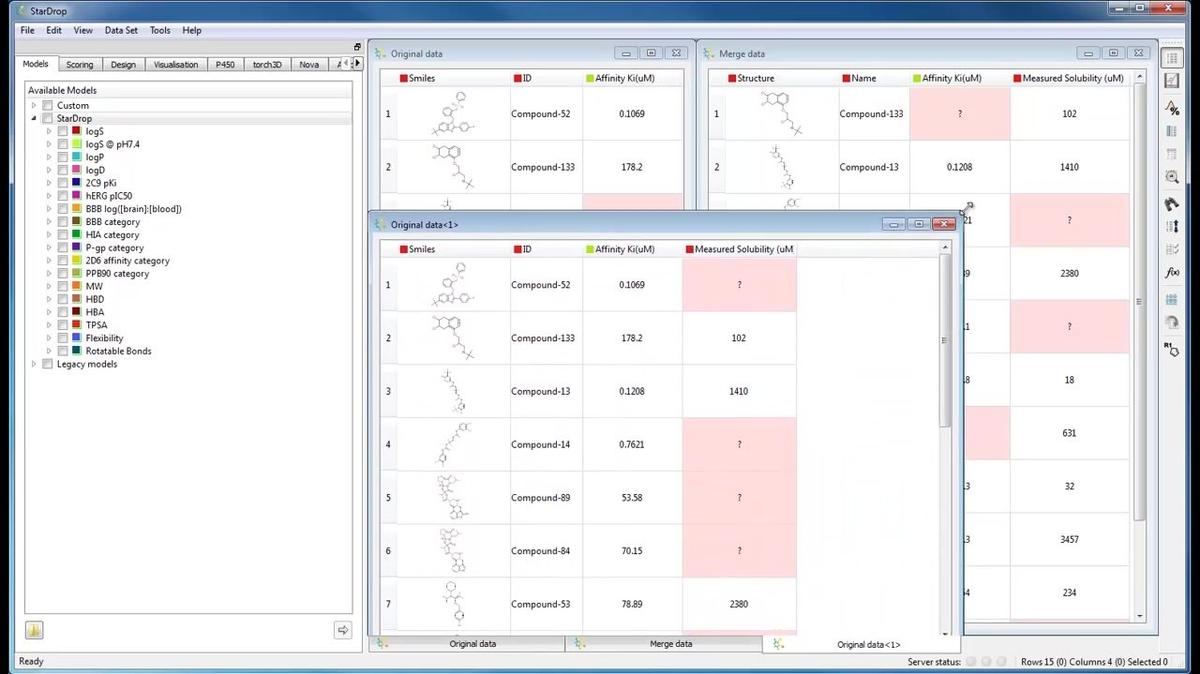
Merging data sets
Do you ever have trouble merging new experimental data back in with all the other information you have for your project? StarDrop makes this very easy. Take a look at this quick introduction...
-
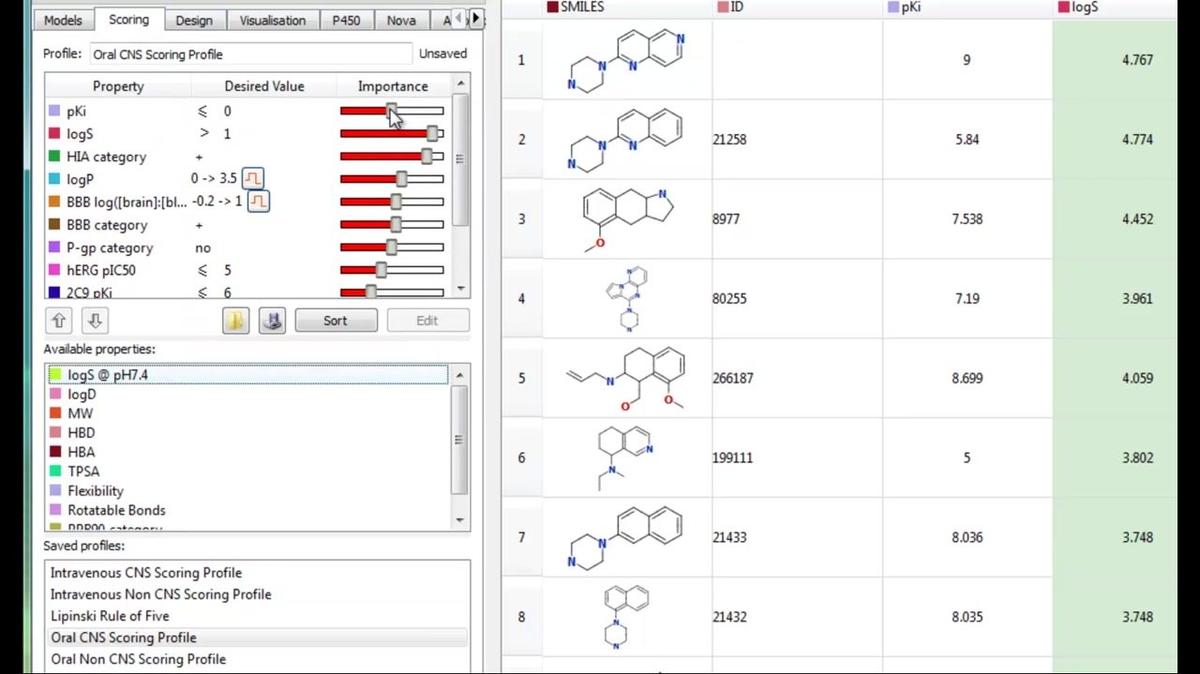
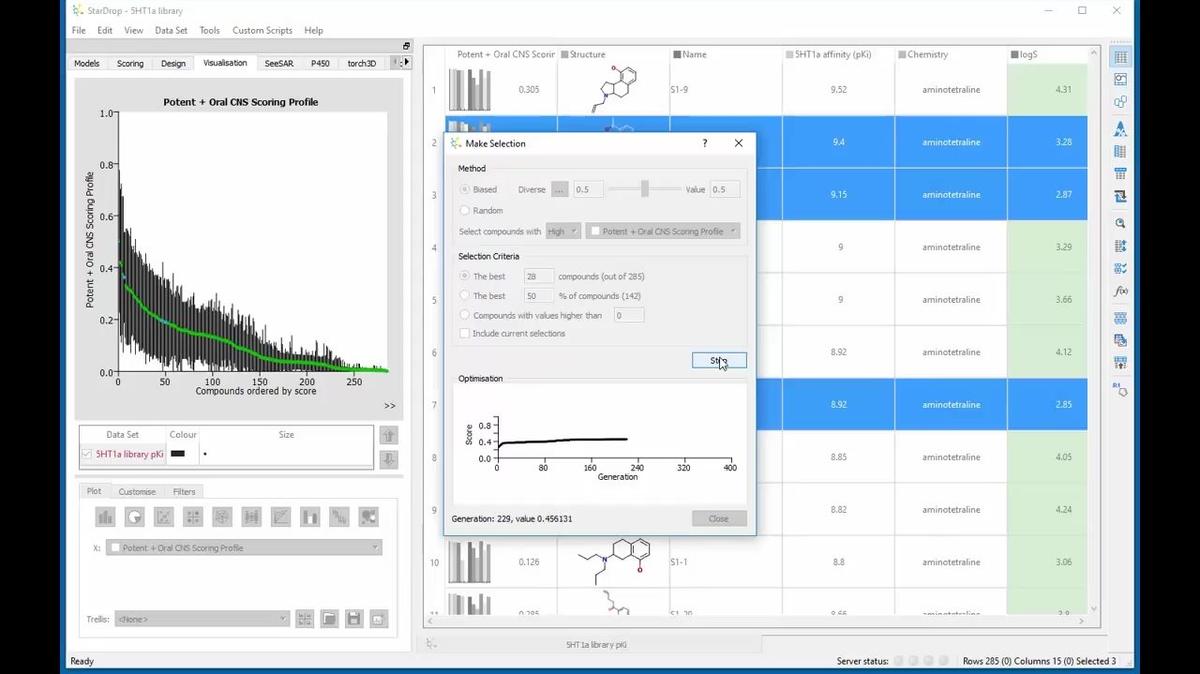
StarDrop Probabilistic Scoring
StarDrop's probabilistic scoring is a powerful multi-parameter optimisation (MPO) technique but we've made it really easy to use so that you can find out which compounds have the best balance of properties. Take a look...
-
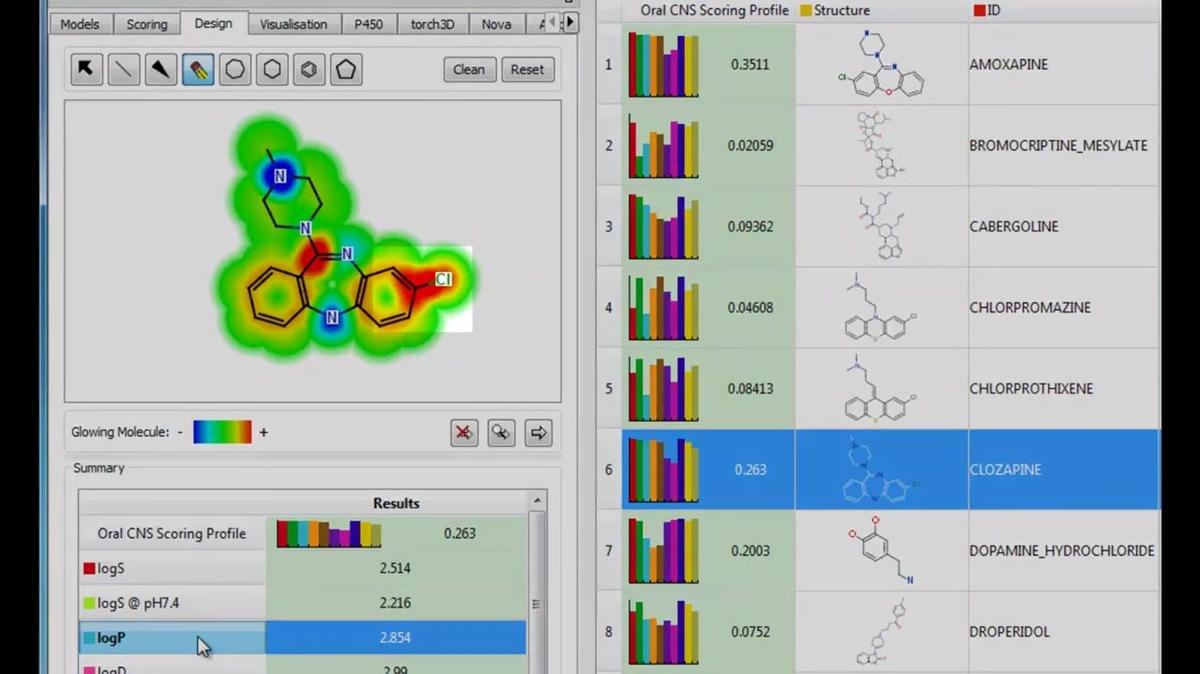
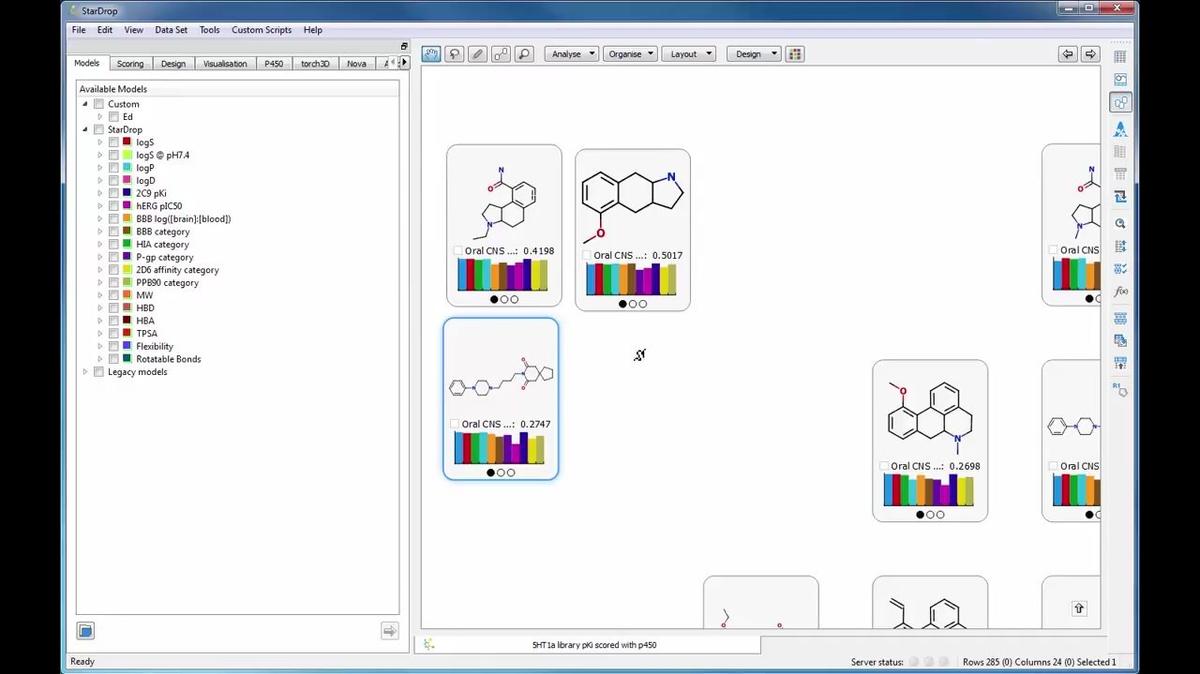
Glowing Molecule
StarDrop's Glowing Molecule brings model predictions to life, showing you which parts of a molecule are having the biggest impact on its predicted properties. This quick introduction shows you how...
-
Annotating Visualisations
This short demo shows you how you can add annotations to your data visualisations within StarDrop.
-
Log Scales
This short demo shows you how you can use log scales when setting up axes or colours within your StarDrop data visualisations.
-
Clustering
This short video gives an introduction to the Clustering tool in StarDrop and how you can interact with the results in Card View
-
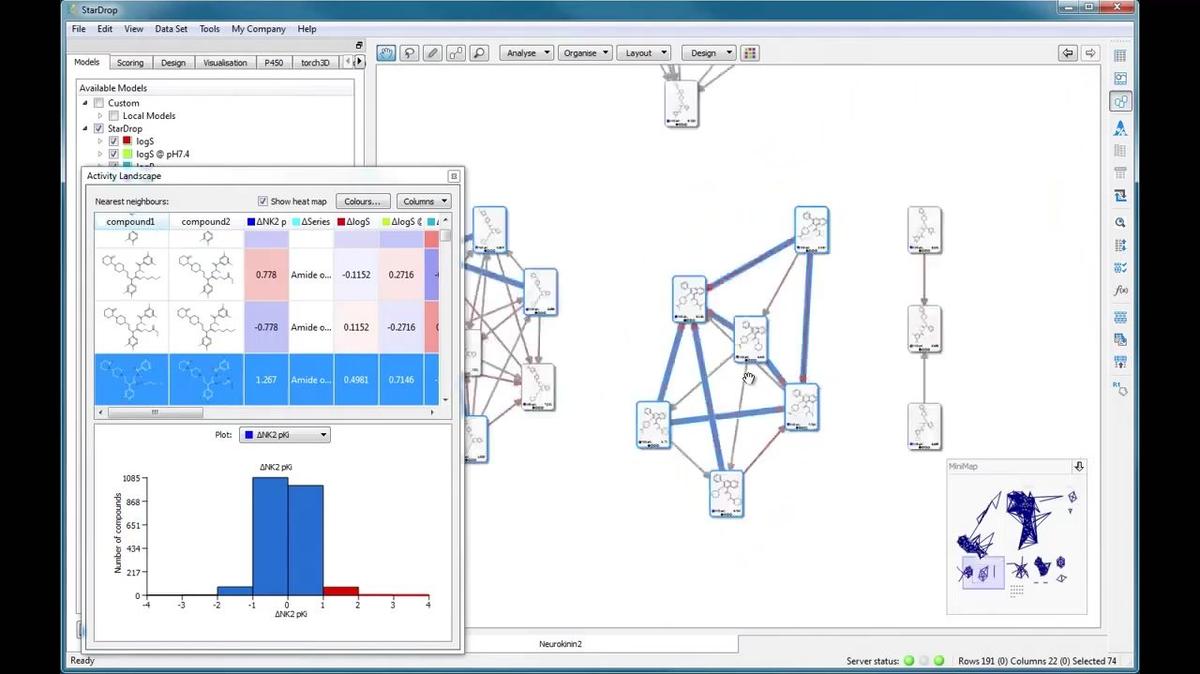
Activity Landscape Analysis
This short video gives an introduction to the Activity Landscape analysis tool in StarDrop and how you can view and interact with the results in Card View.
-
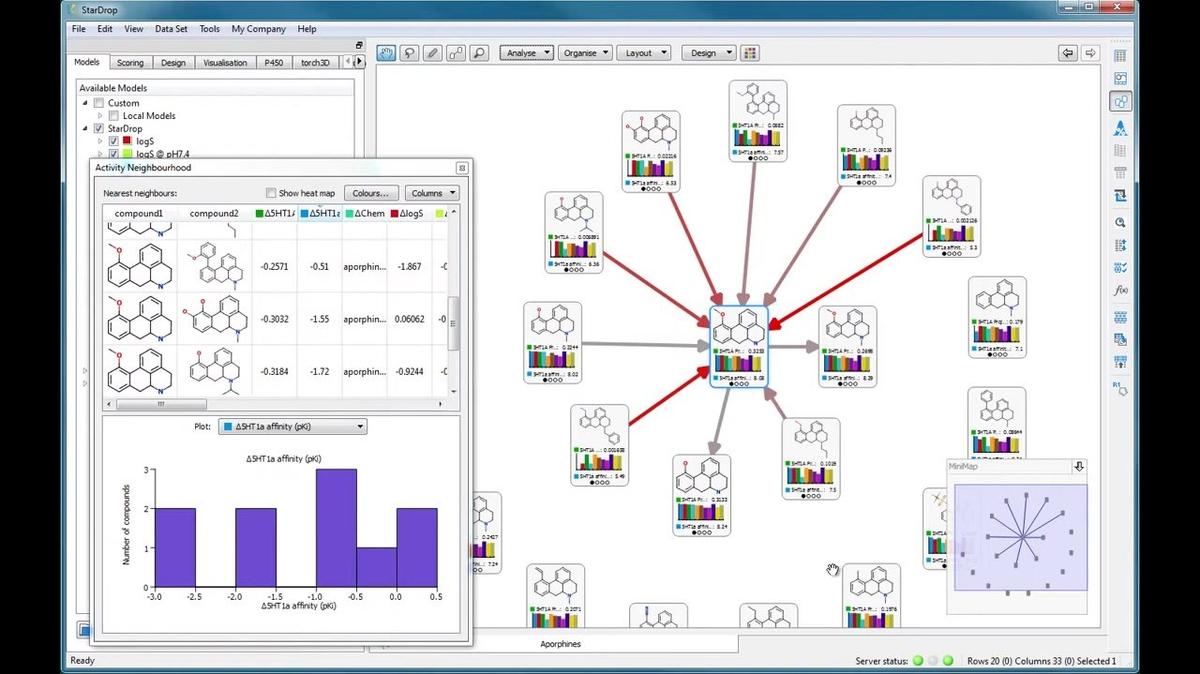
Activity Neighbourhood Analysis
This short video gives an introduction to the Activity Neighbourhood analysis tool in StarDrop's Card View.
-
Matched Molecular Pair Analysis
This short video gives an introduction to the Matched Molecular Pair Analysis tool in StarDrop and how you can interact with the results in Card View. If you are interested in Matched Molecular Pair Analysis, you may also like to see the tutorial on Matched Series Analysis, which goes beyond matc...
-
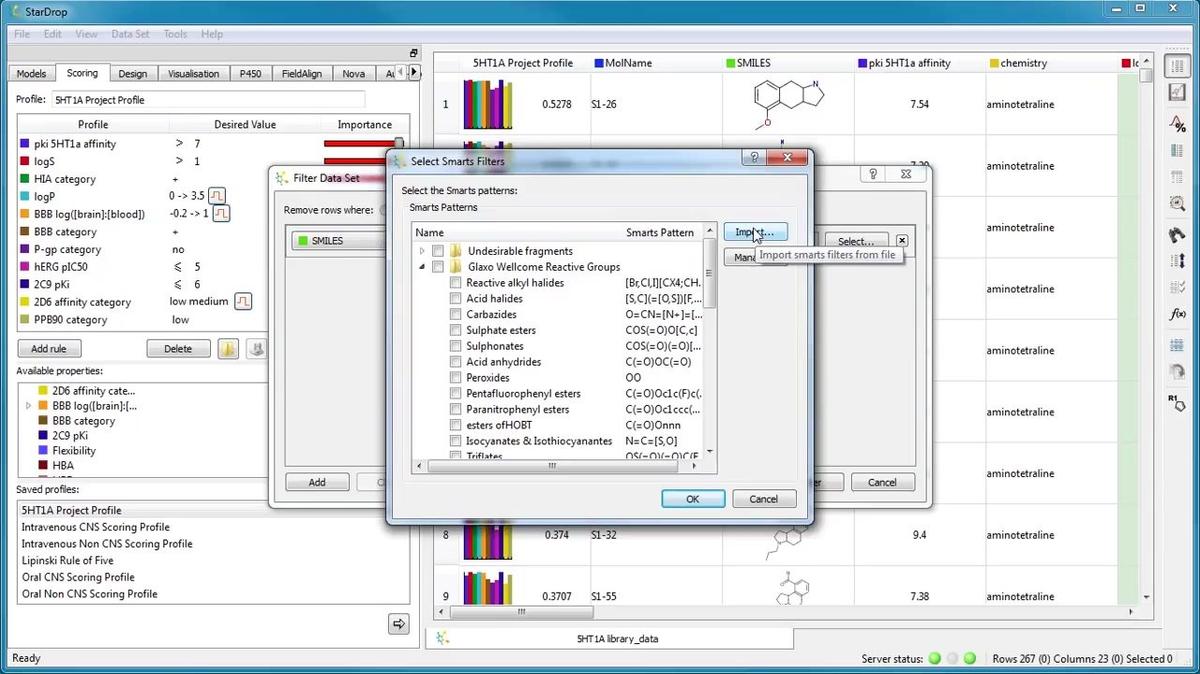
Dataset Filtering
This short movie illustrates how to use the data set filtering tool withing StarDrop to remove compounds with unwanted substructures or property values from your data set.
-
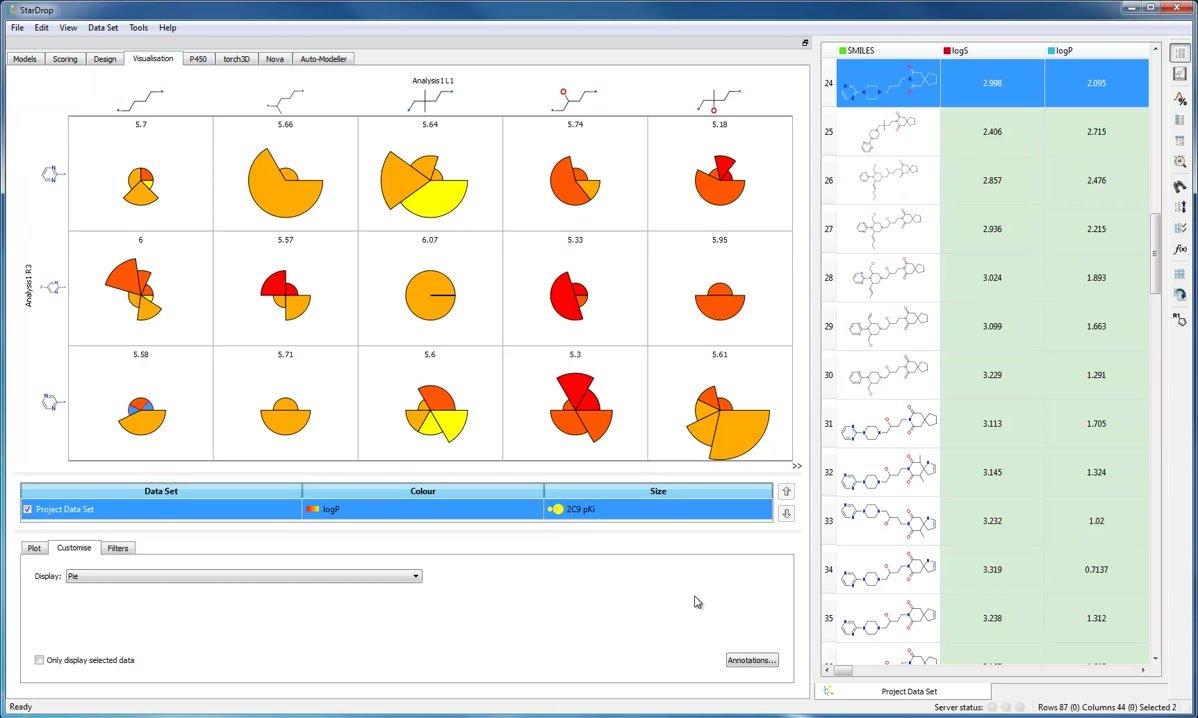
Information Rich SAR Visualisation
This short movie illustrates how to create information-rich SAR plots, including pie charts, histograms or radar plots to view property distributions by R-group in StarDrop's data visualisation tab.
-
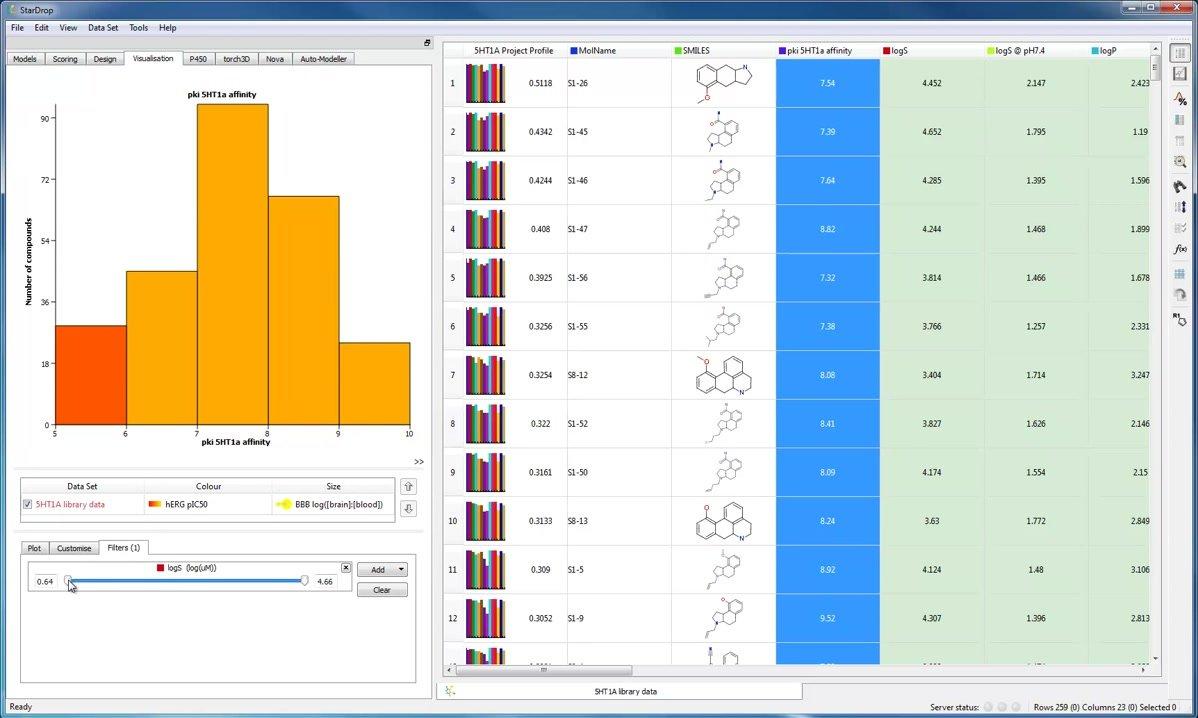
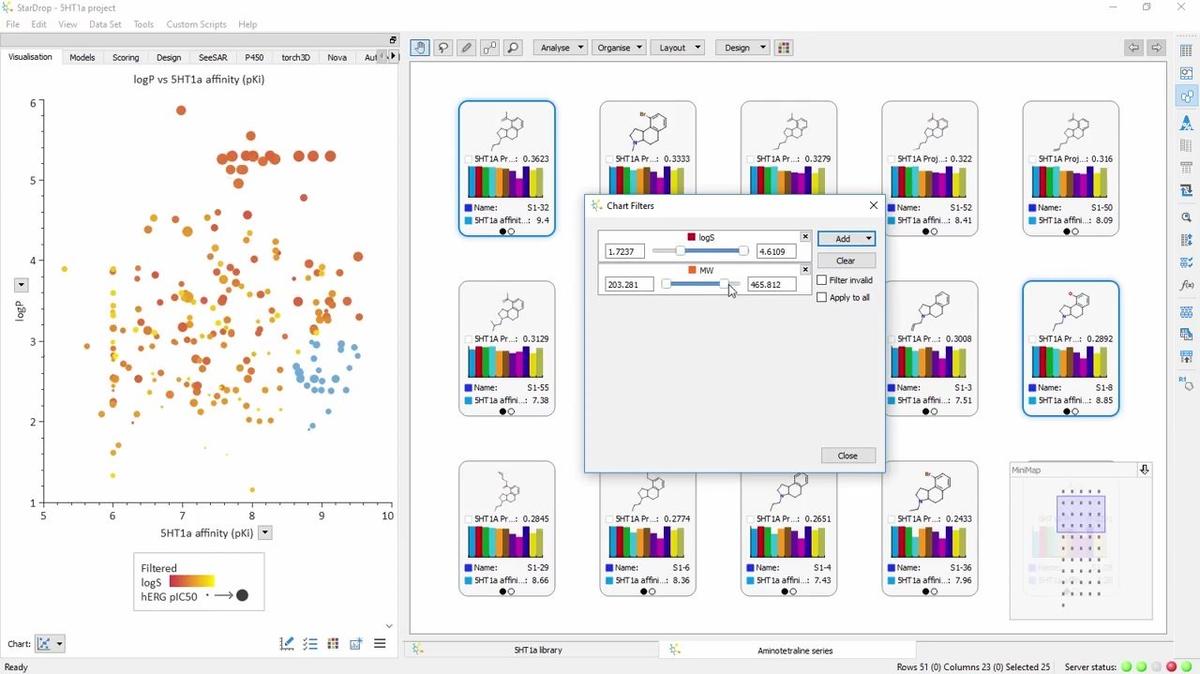
Visual Filtering
StarDrop's visual filtering tool enables you to filter the data displayed in your graphs and plots interactively. This demonstration shows how you can apply filters for one or more properties in your data set to quickly focus on the most interesting compounds.
-
Keeping Track of Selected Compounds
StarDrop's provides a number of ways to help you keep track of compounds you have selected. Take a look at these quick examples...
-
Getting Started in Card View
This short video provides some hints and tips to help you to get started using StarDrop's Card View. The next video in the series gives an introduction to tools for arranging cards in Card View.
-
Tools for arranging cards
This short video gives an introduction to the tools provided by StarDrop's Card View that help you to arrange cards for your data set to identify clear patterns and structure-activity relationships.
-
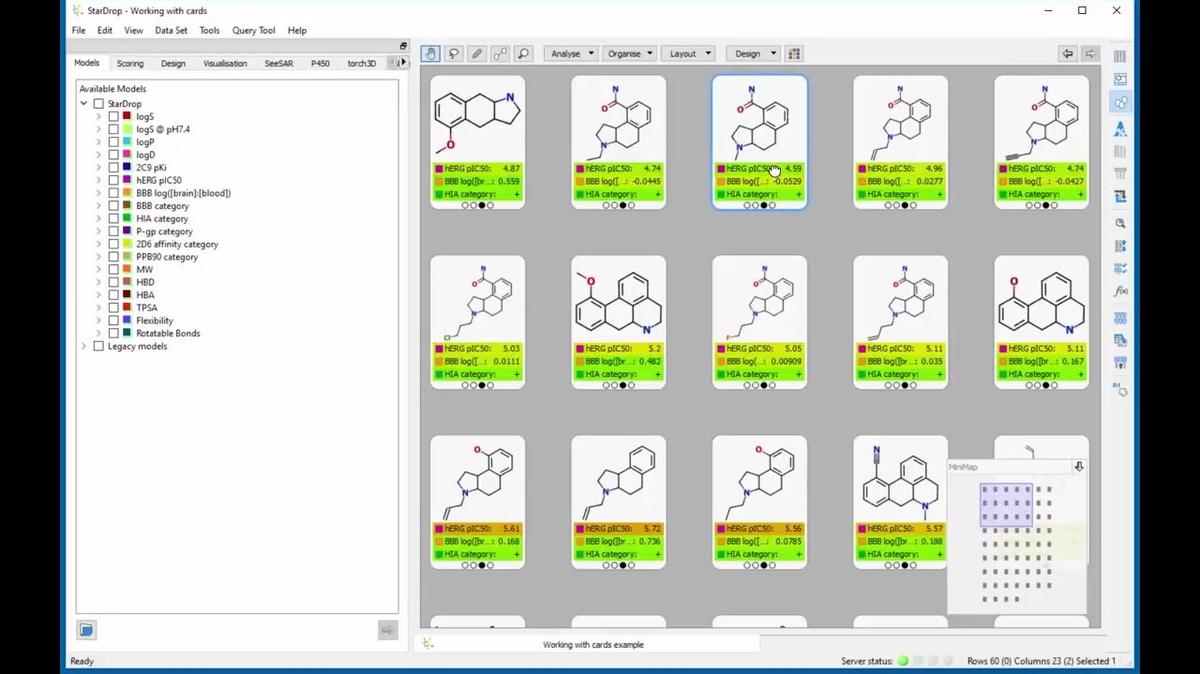
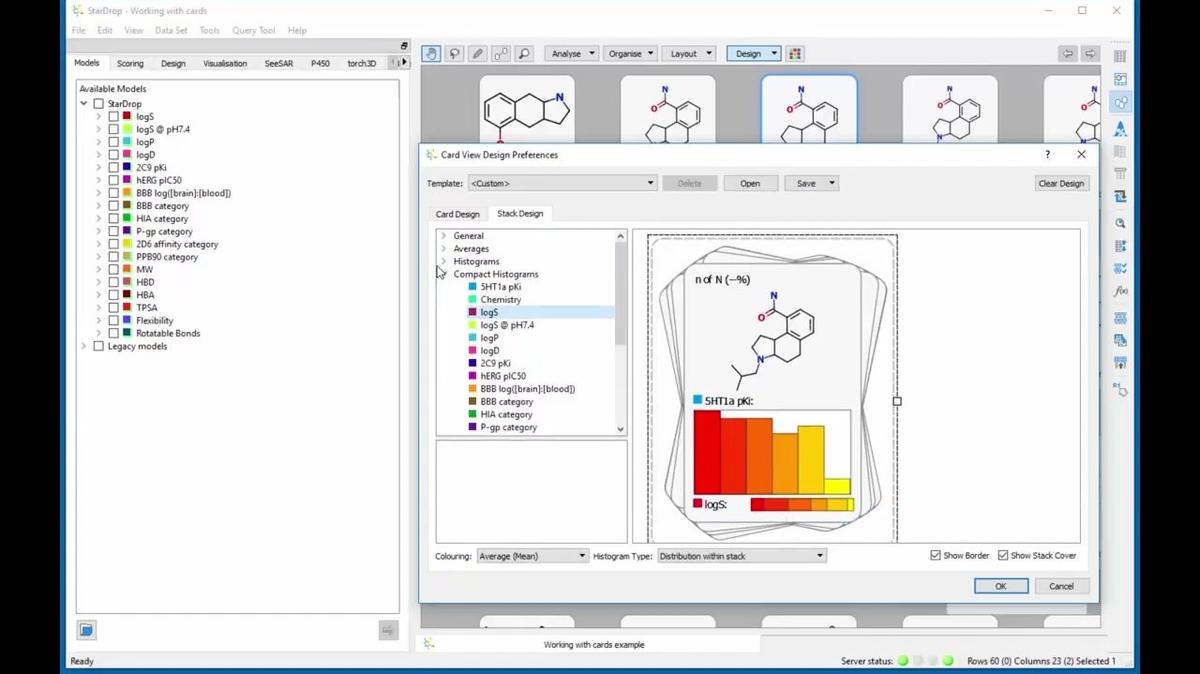
Working with cards
This short video gives an introduction to working with cards in StarDrop's Card View.
-
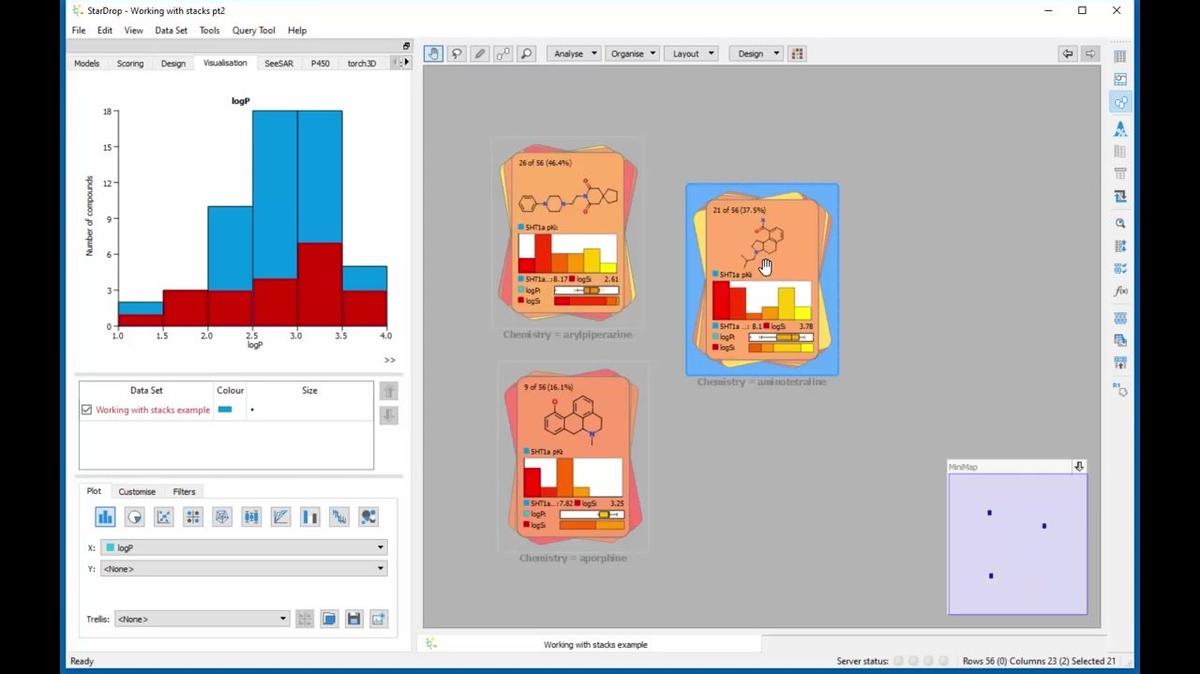
Working with Stacks
This short video gives an introduction to working with stacks in StarDrop's Card View.
-
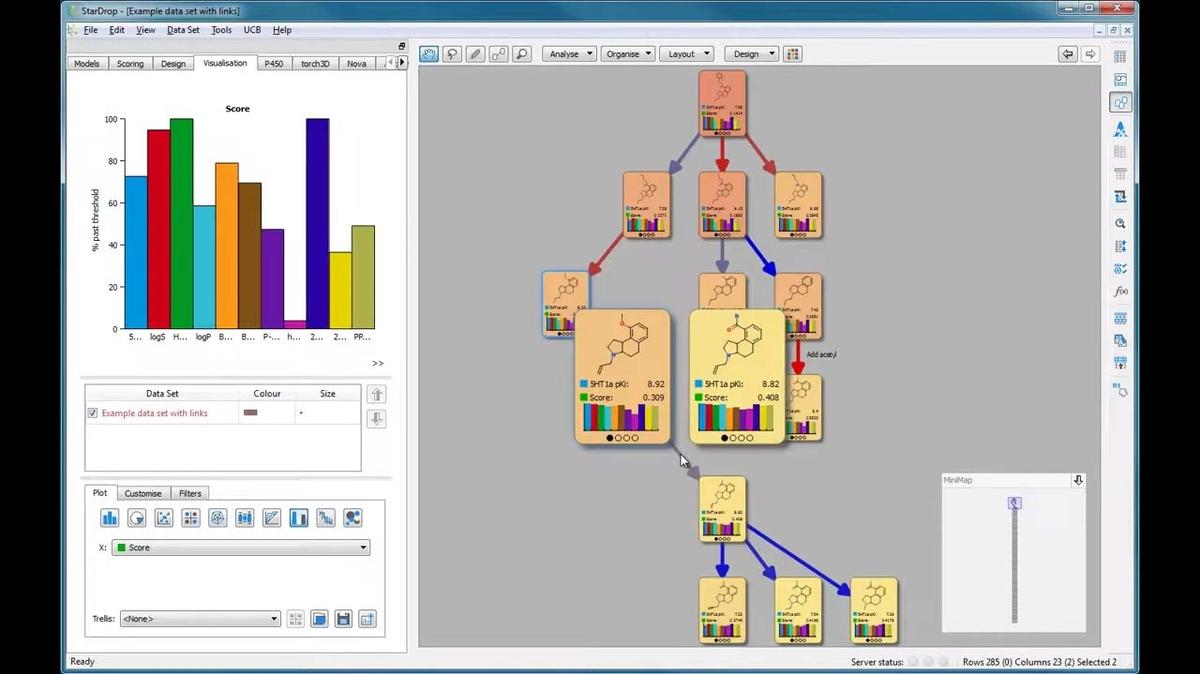
Working with links
This short video gives an introduction to working with links in StarDrop's Card View.
-
Importing Your Data into StarDrop
This short video illustrates how to import your data into StarDrop from standard file formats, such as SD, SMILES, CSV and text files.
-
Introduction to Card View Designer
This short video illustrates how to you can create Cards of any dimensions and lay out your data in a flexible format, along with your own titles and labels.
-
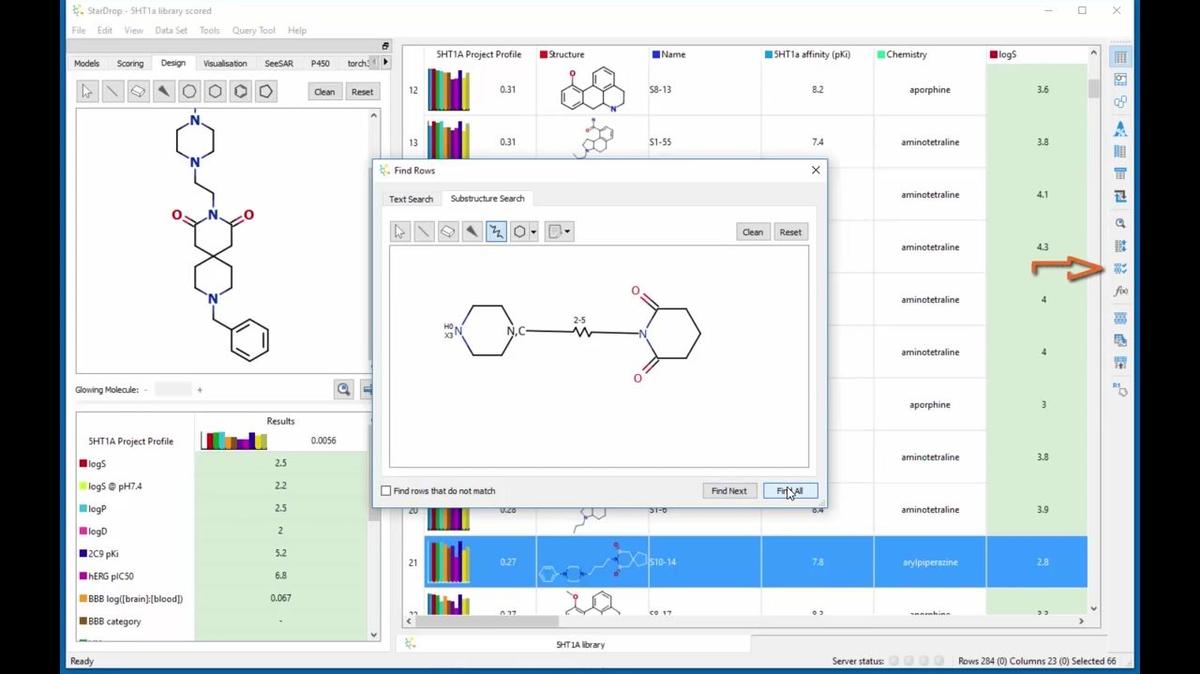
Flexible Substructure Searching
This short video illustrates how to perform flexible substructure searches, including variable atoms, bonds and linkers using StarDrop's Find tool.
-
R-group Matched Pairs
This short video illustrates how to perform Matched Molecular Pair Analysis (MMPA) within a chemical series using StarDrop's R-Group analysis tool This is quite a specific form of MMPA and you may also be interested in the short video describing the general MMPA tool in StarDrop and how it can b...
-
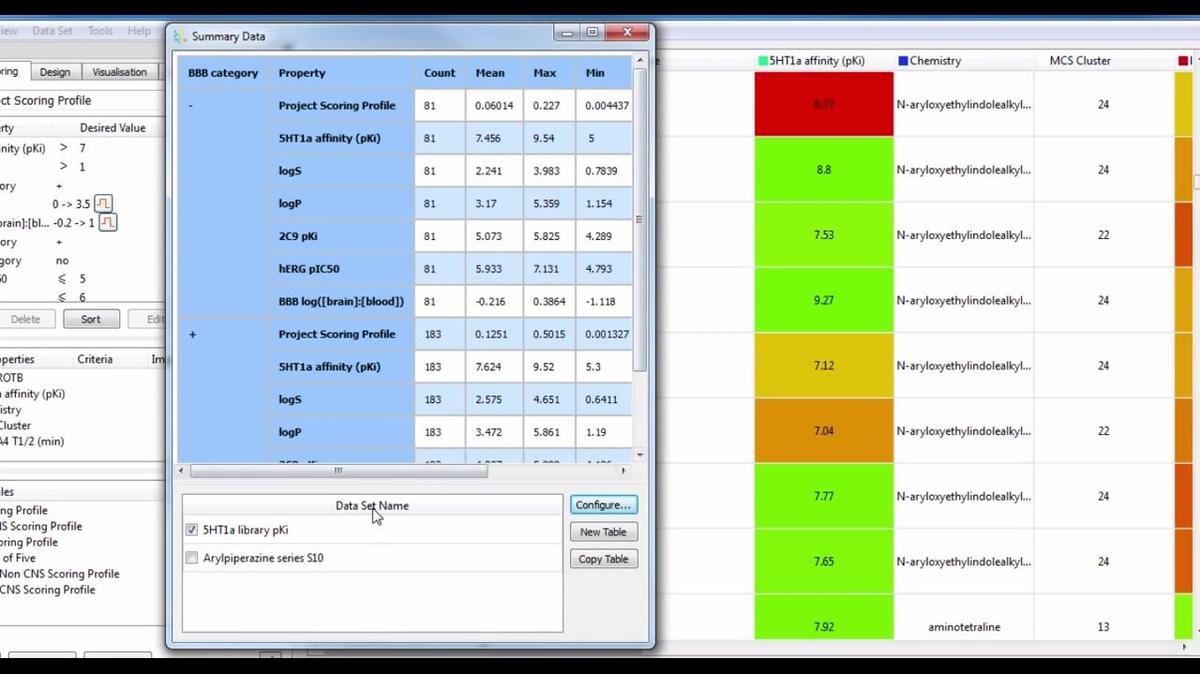
Summary Analysis
StarDrop's Summary tool enables you to quickly see trends across the properties in your data sets. Take a look at this quick introduction...
-
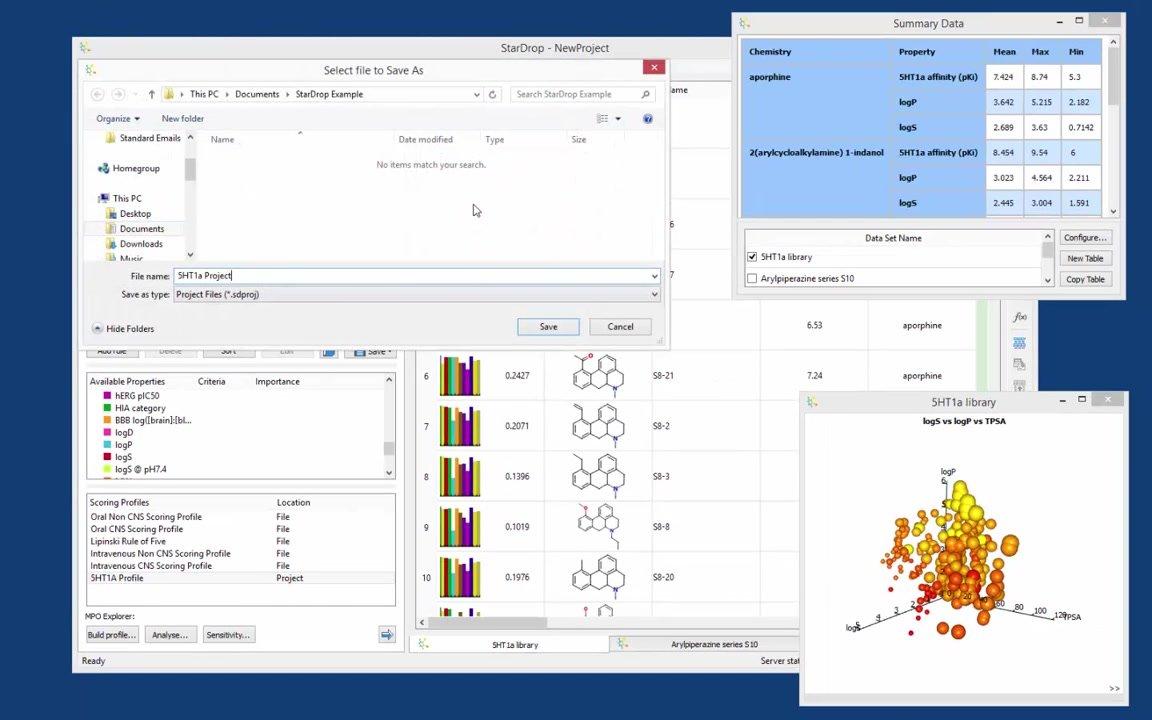
Projects
StarDrop project files enable you to save all of your data sets, visualisations, scoring profiles and templates in a single file making them easy to share and update. Take a look at this quick introduction...
-
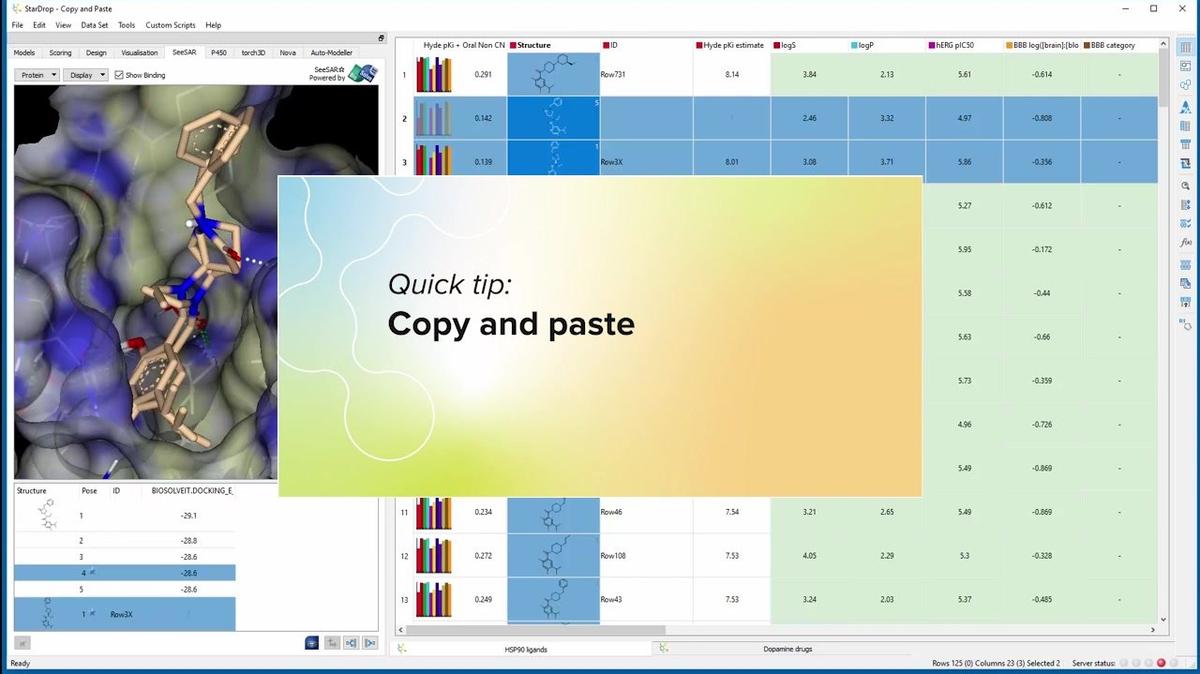
Copy and Paste From StarDrop
This short video gives a quick overview of copying and pasting between StarDrop and other desktop software.